Introduction
BRM (Bottleneck Resolution Method) is a Process Improvement strategy to enhance service and administrative processes. It offers a pragmatic way to enable team discussions to map out the current process and to identify and implement opportunities for improvement.
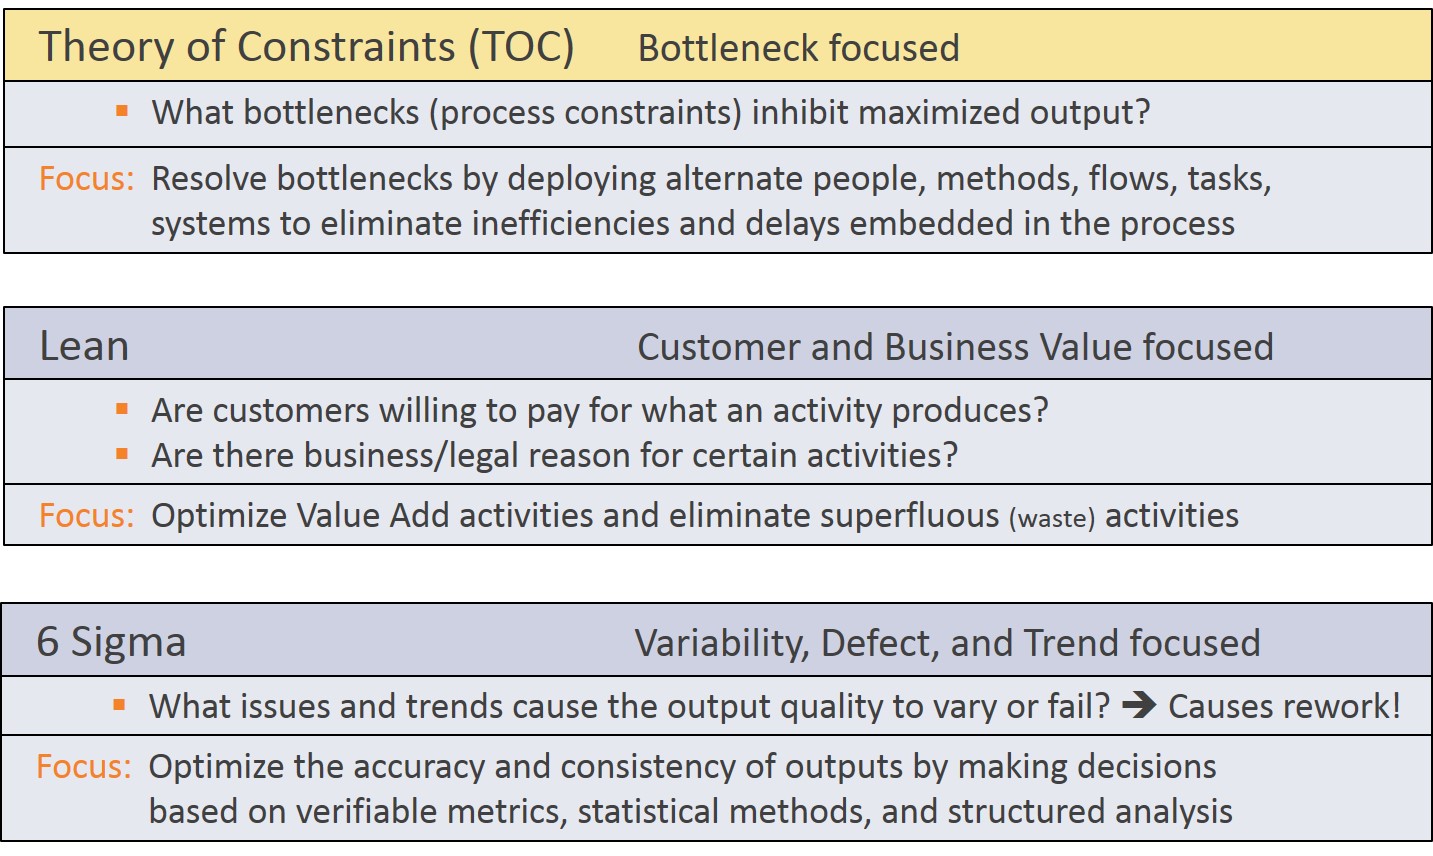
BRM combines concepts from other Process Improvement methods, including bottleneck resolution (Theory Of Constraints - TOC), non-value-add elimination (Lean), and defect reduction (6 Sigma). However, BRM avoids the more complex aspects of those methods to create a more streamlined approach focused on what service and business teams can feasibly improve.
The method can be applied without hiring experts, such as 6 Sigma black belts. Nevertheless, it is good to use a facilitator, for example a team member with good personal skills. This toolkit provides guidance for facilitators to enable BRM within their organization.
While BRM promotes using metrics, this is not required to gain significant impact on service and administrative processes. Nevertheless, it helps if facilitators have an understanding of metrics, so they can recognize when introducing some metrics might be useful.
While this toolkit can be used to improve service and administrative processes in any industry, the target audience is the healthcare provider community. As such, many of the incorporated examples are health care related.
What is a Process?
A process can be defined as a series of activities, tasks, decisions, interactions and handoffs executed by resources to convert a set of inputs into a set of outputs. Resources refers to employees, machines, computers, and other systems.
This definition of process may seem less apparent for service and administrative processes than for manufacturing processes that create products, but this definition helps in understanding Process Improvement. Consider for instance these two examples:
- A clinical service process can convert a sick patient (input) into a healthy patient (output) through a series of clinical treatments (activities and decisions).
- An administrative process can convert completed treatments (inputs) into invoices (outputs) for insurance companies and other payors through administrative activities.
Processes can be executed by individuals or teams. Teams can operate within a single function (functional) or across multiple functions (cross-functional), and within one or across multiple organizations. Some processes are formalized in procedures, others are informal, or consist of a mix of formal and informal procedures. BRM works best for team-based processes.
Why Process Improvement?
Process Improvement can increase the quantity and quality of what a business produces at a decreased cost per unit of output. The improvements can free up resource capacity that can be invested in growing the business and its competitive advantage. This will enable a culture that increases profitability, boosts impact, and enhances employee growth.
Processes may be inefficient and prone to defects (process and system flaws or failures, human errors, mistakes, etc.), which reduces the quantity and quality of the outputs. The more complex the process, and the more people involved, the more issues tend to arise. Process Improvement can help in identifying and resolving inefficiencies and defects.
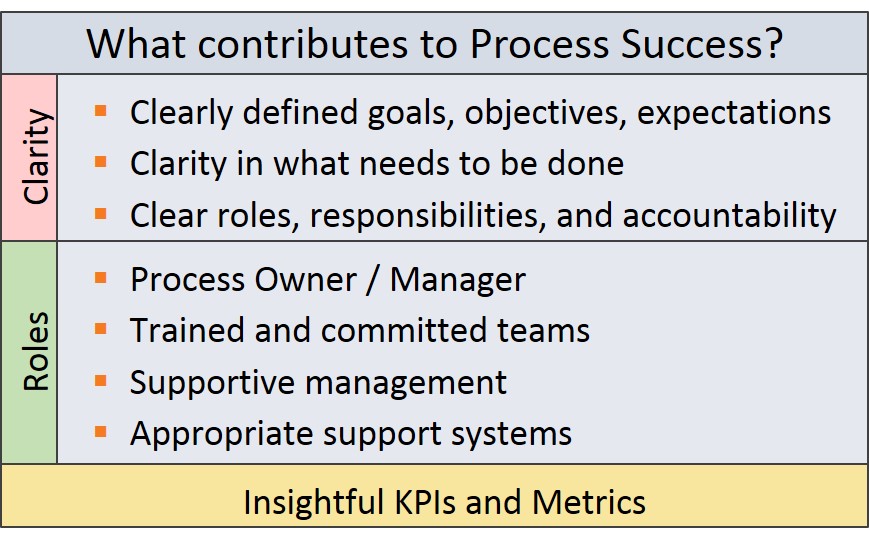
Clarity is a core driver for the successful execution of a process. Processes need clearly defined goals, objectives, and expectations of what needs to be accomplished; clarity in what needs to be done to create the desired outputs; and clear roles with well defined responsibilities and accountability. Process Improvement can assist in establishing clarity.
From the roles perspective, successful processes typically have a process owner and manager who are supportive of their team; a trained and committed team that is motivated to execute the process; and support systems that appropriately assist what the team is supposed to do. Process Improvement can enable the clear definition and alignment of the roles.
The Lifecycle of a Process
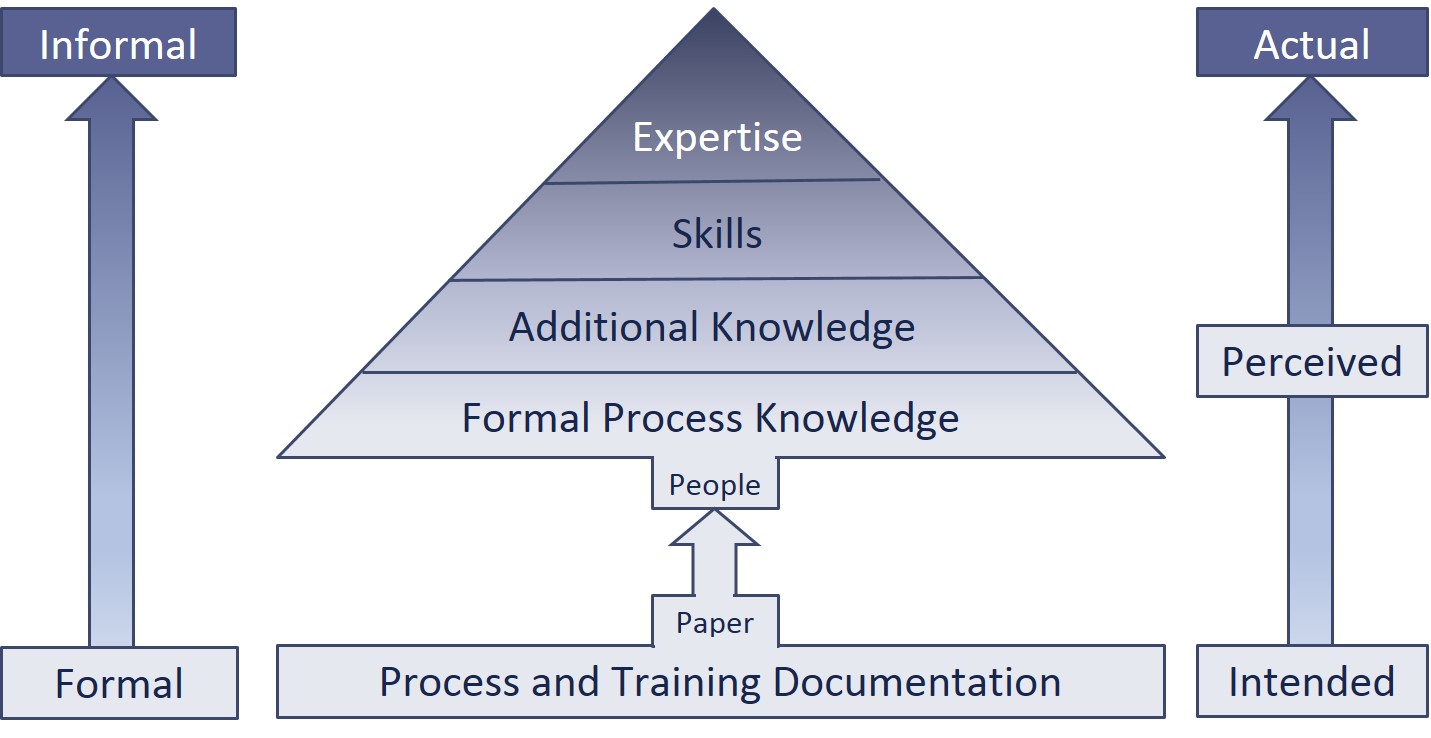
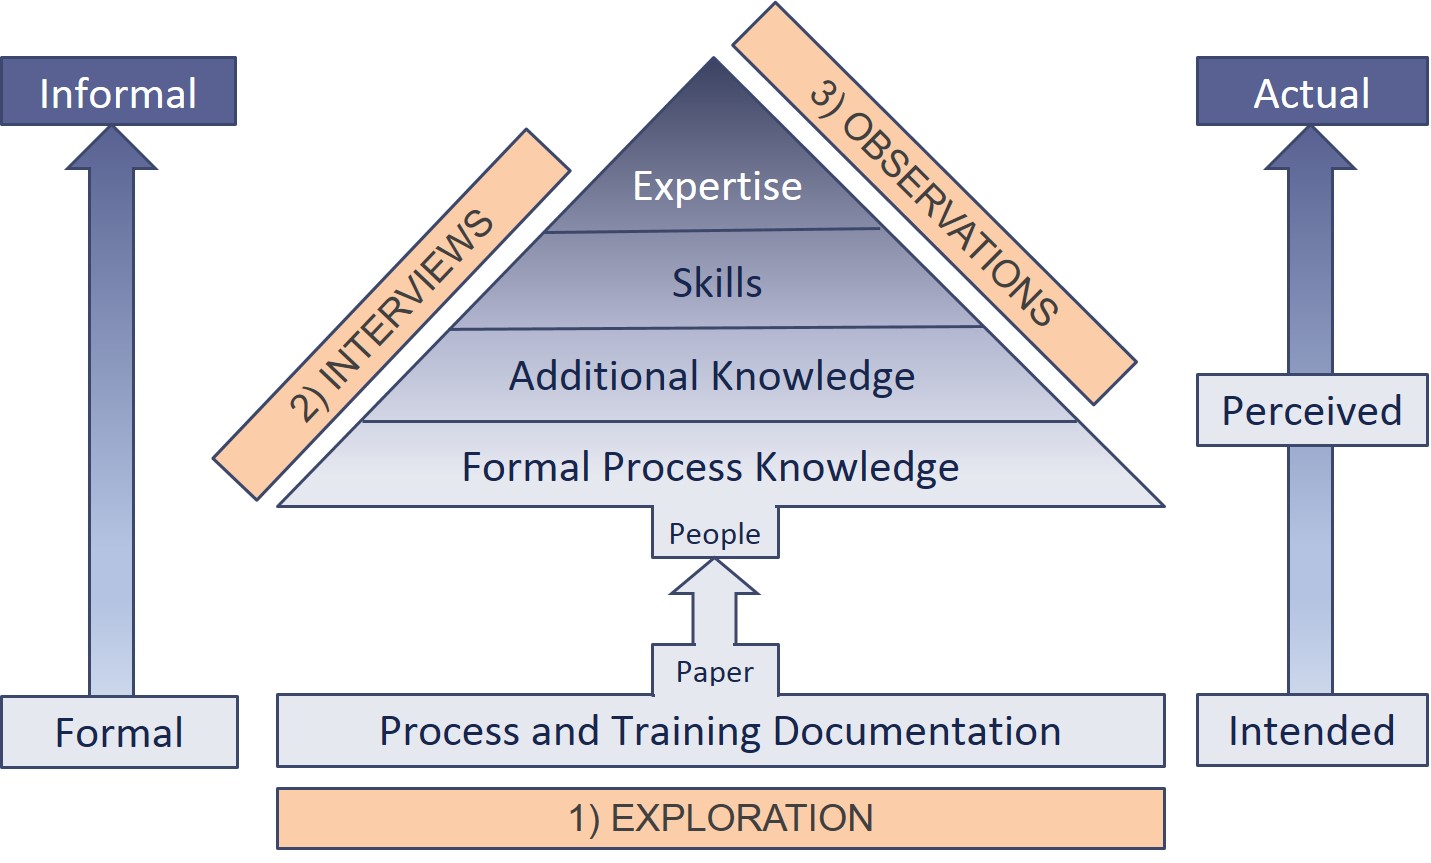
When a process is initiated, the intended design is typically formalized in process and training documentation written by managers, process teams, and process designers. This documentation can be used to train the initial process team, and people who join this team later on. However, over time the process will likely begin to deviate from how it was originally documented:
- Deviations may be introduced deliberately. For instance, adaptations will need to be made to refine the process. However, if such changes don't get documented, they become an informal part of the process that people might not be aware of.
- Adaptations may also be introduced inadvertently. People tend to incorporate their knowledge, skills, and experience to make their work efficient. They introduce shortcuts, add steps they think are missing, or skip steps they deem irrelevant. This adds informal aspects to the process that the manager and other team members might not know about.
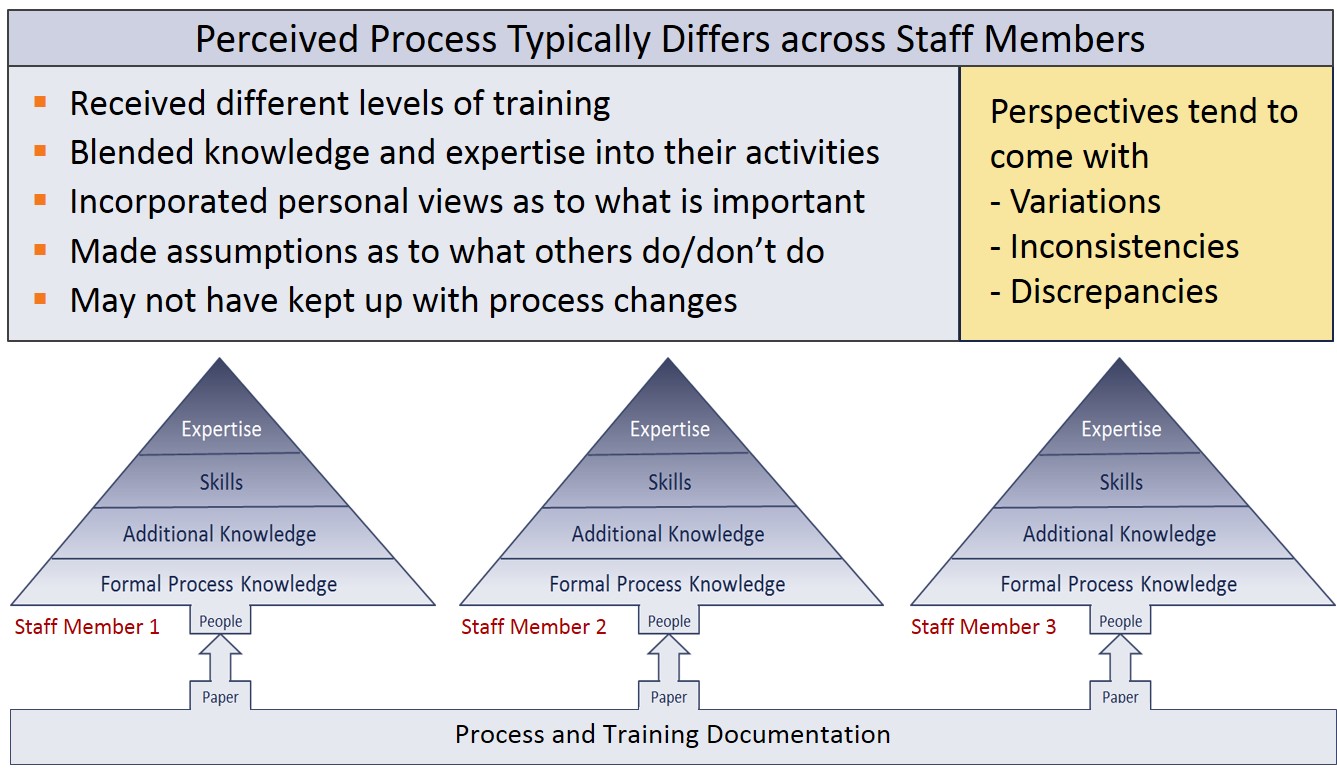
Over time, the process will become more informal. Perceptions of the manager and team members of how things work will begin to differ, because people often don't tell others how they have incorporated their knowledge, skills and expertise to improve what they do.
This divergence gets exacerbated by the fact that people tend to make assumptions about what others do without verification. As assumptions may be incorrect, the way the manager and team members perceive the process will likely not match the real process.
It may seem that this evolution would be detrimental to the results of a process, but attempts to suppress the progression will likely have adverse and undesirable consequences. For instance, it will create discord and demotivation, as people want to use their knowledge and expertise. Moreover, the informal activities added to a process by the employees often make processes more efficient.
In a manufacturing environment it is fairly easy to justify that all activities should be executed exactly to design specifications, as you don't want the products to vary in quality. However, in service and administrative processes the outputs aren't as clearly defined, and employees tend to be much less accepting of strict controls that stifle their personalized input.
Nevertheless, to avoid that the outputs end up deviating from what is required, it is imperative to get everyone back on one page on a regular basis. A process will work better and more consistently if the manager and team are aware of how the process actually works and know what others do. This is where the BRM Process Improvement strategy can help.
Overview of the Bottleneck Resolution Method
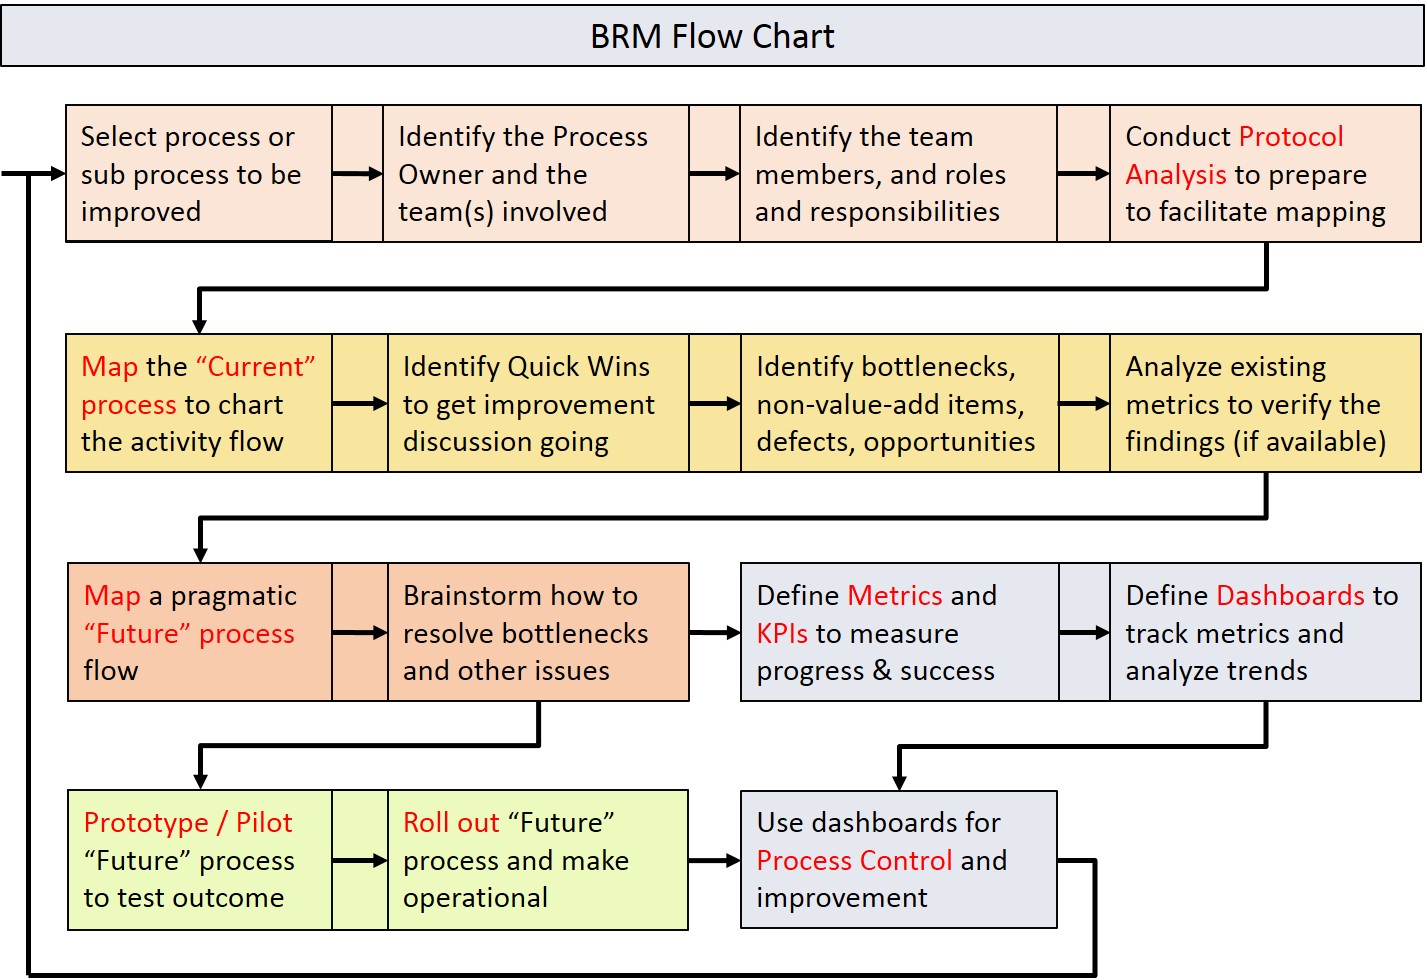
To learn how BRM works, first read the sections below, and then read the tabs of this toolkit in the order listed. Each tab is a course that explains a major BRM topic. As the content is rich in information, we advise reading the tabs in multiple sittings. The graphic below provides a flow chart of the full BRM Process Improvement strategy, based on all topics covered in this toolkit.
Process Selection
For process Improvement to work, it is important to get off to a good start. It works best if the team can successfully improve some simpler processes, before expanding the effort to complex processes. This enables that the team gets excited about the results and stays motivated to continue. The first step is therefore to select processes where improvement has a reasonable chance of success.
Select the "Process Selection" tab to learn about tools that can enable the team to make a good selection.
Process Mapping
After Process Selection, the next step is Process Mapping. During a mapping session, the team will map their activities. The aim is to get everyone on one page, to align the perspectives, and to establish mutual understanding of how the process really works, as the starting point to make realistic improvements everyone can agree to.
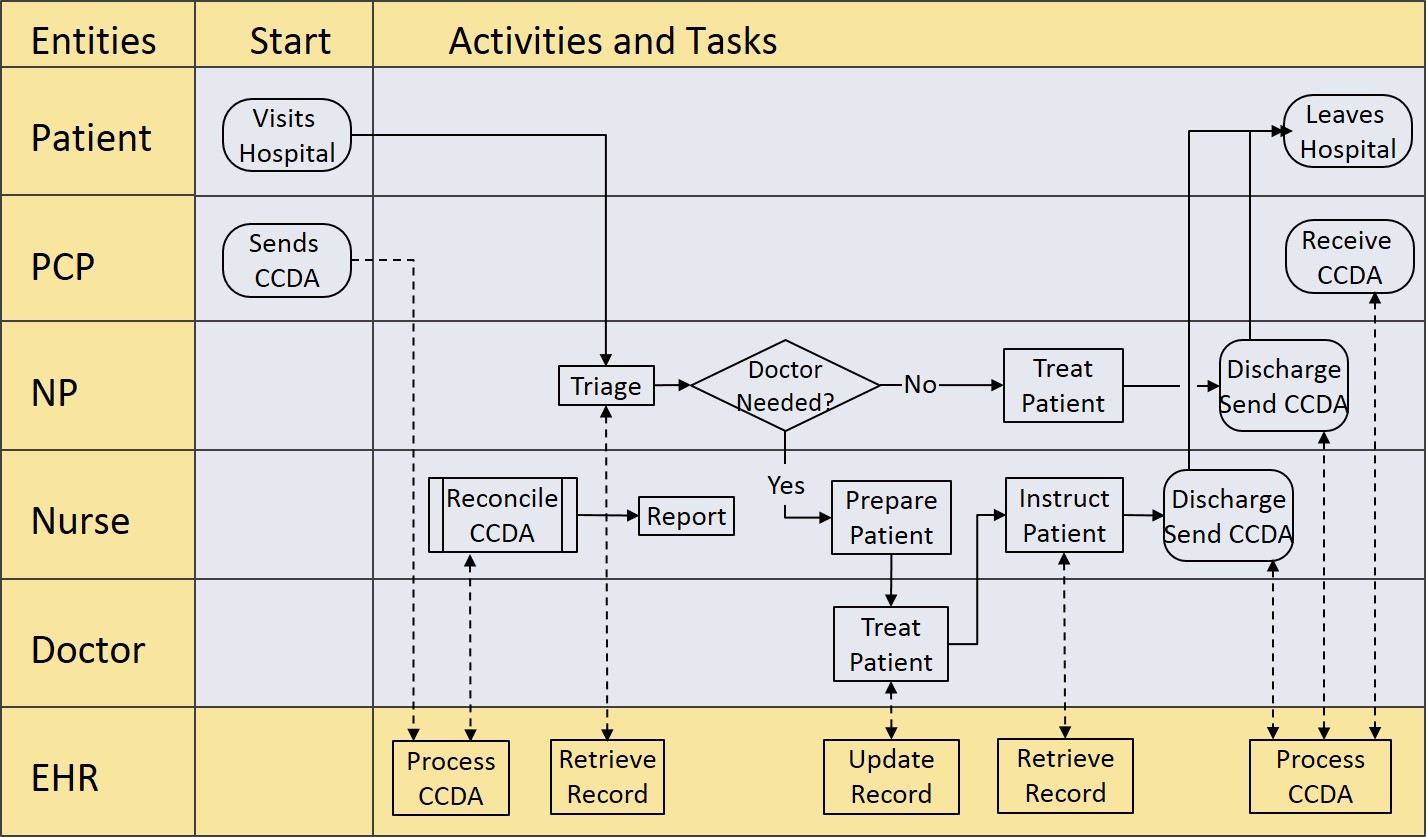
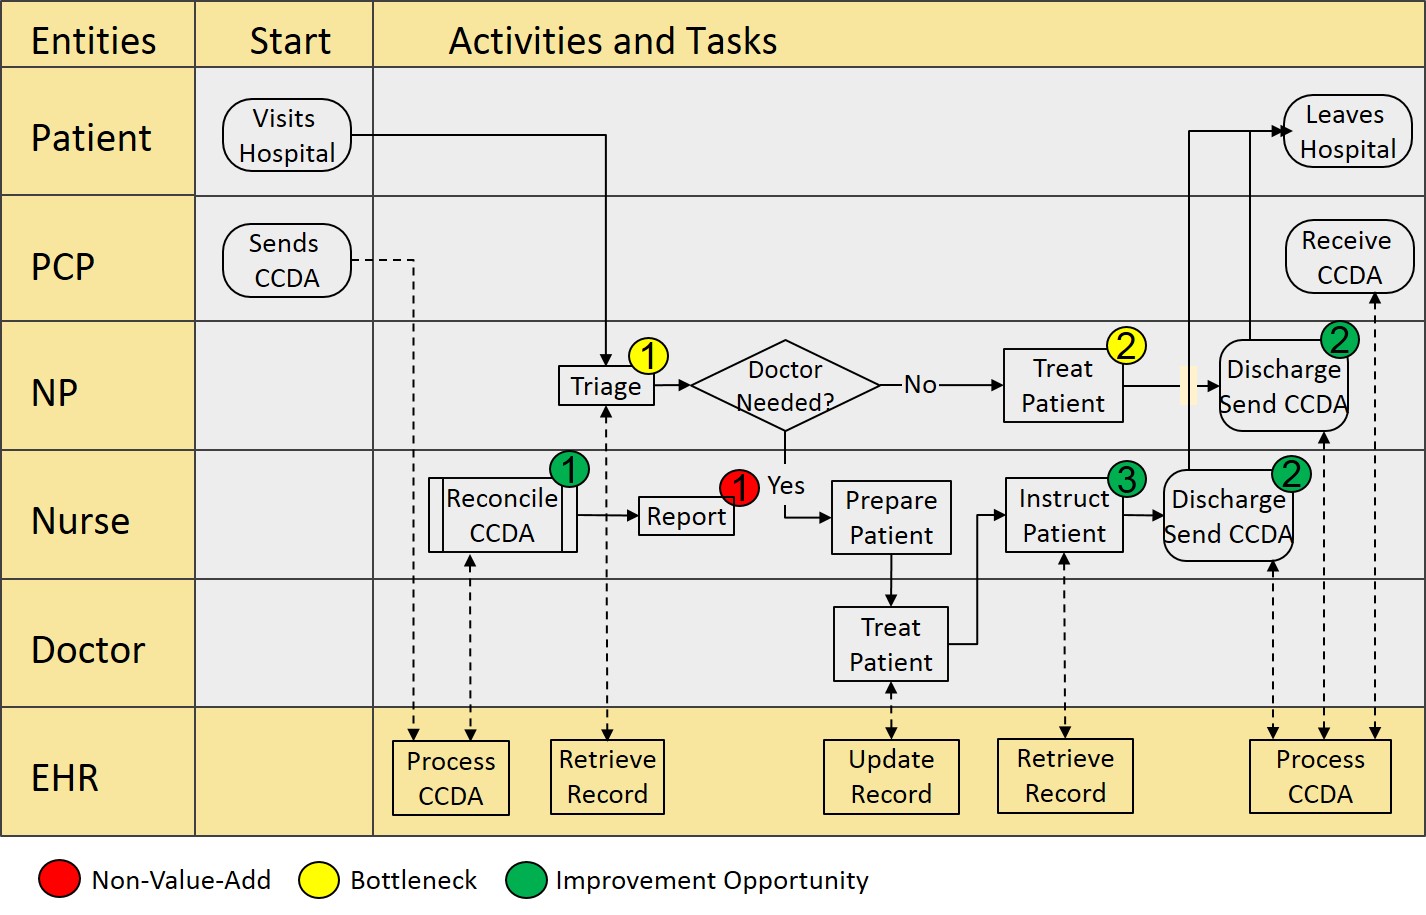
Process maps look like the graphic shown below. This example map shows a process with multiple clinicians involved in triaging, treating, instructing, and discharging a patient. Throughout this toolkit, this example will be used to illustrate the concepts explained.
A process map is basically a structured flow diagram. The added structure ensures greater clarity by avoiding the unwieldiness that often comes with traditional flow diagrams. This clarity will help in identifying process flaws and designing improvements.
In particular, the structure is conducive to establishing insight into who executes the various activities, the sequence of activities, and the hand-offs that occur to pass on the work between the people and systems that execute the process.
The main value of Process Mapping is the team discussion to uncover how the process works. This yields a great starting point for improvement discussions, but it is best to wait with improving the map until there is mutual understanding of how things currently work.
Select the "Process Mapping" tab to learn how to map a process.
Process Improvement
To establish success in Process Improvement, it is key to have a sound strategy that drives how the need for improvements will be identified, how the related process changes will be defined, and how success will be measured. This toolkit explains the strategy used in the Bottleneck Resolution Method (BRM).
It is important to not only know how the process works, but also how well it works. During Process Mapping, participants will discuss what they think works well. They will also disclose process flaws they are aware of, and through the discussion they will discover issues they weren't aware of.
Although this information is based on impressions and anecdotal evidence, these qualitative indicators provide a foundation to apply the BRM Process Improvement strategy. BRM can result in significant improvement even if the team hasn't quantitatively measured the actual process performance. It is in fact fairly common in service and administrative processes to have no or only limited metrics.
Select the "Process Improvement" tab to learn how the BRM strategy works.
Productivity Metrics
While qualitative impressions and anecdotal evidence provide a foundation for improvement, this may yield insufficient quantitative insight to refine the improvements. For instance, perceptions of how frequently certain issues happen is often biased. Small issues might seem relevant just because they occurred recently, and vice versa.
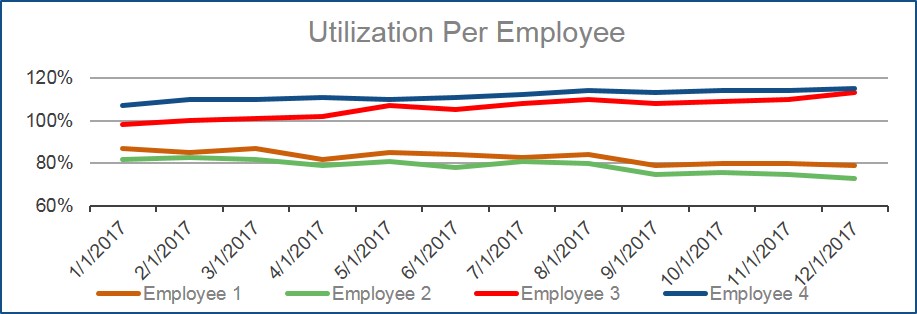
Advanced applications of BRM use Productivity Metrics to determine which improvements will be most effective. Metrics supplement qualitative impressions with quantitative insight. For instance, the employee utilization graph below shows that some employees are busier than others. This data would quantify a qualitative impression that this is the case.
Productivity Metrics measure process performance, such as time spent on activities, delay and wait times, and the quality of output. Such metrics can support decisions as to what to improve, and measure whether the improvements worked. As using metrics can get overwhelming, BRM proposes to keep the use of metrics simple and incremental.
Select the "Productivity Metrics" tab to learn more about how to use metrics effectively.
If using metrics isn't an option, still read the Productivity Metrics tab. Understanding the concepts behind metrics may offer insights that help in interpreting qualitative impressions and anecdotal evidence.
Facilitator
Process Improvement discussions can release emotions in the team where differing personalities and viewpoints come out and conflicts may arise. For a positive experience, it is therefore preferred to have a facilitator to guide the discussions. The facilitator can also teach the team about Process Mapping and Improvement.
Becoming a good facilitator requires a conducive mindset and some practice. This toolkit explains how facilitators can prepare themselves to implement the BRM method.
Select the "Facilitator" tab to learn more about how to prepare.
Negotiation
The perspectives of how a process should be improved will differ among the stakeholders. They will need to negotiate a solution that works for them and aligns with the business scope, goals, objectives, and budgets. BRM promotes the WIN-WIN Negotiation strategy as the preferred method to resolve the differences between the stakeholders.
The key component of this strategy is to define and negotiate alternative options for addressing the collective interests of the various stakeholders. For this purpose, the Process Improvement tab specifies a number of generic options that can be used to define and negotiate improvement proposals.
Select the "Negotiation" tab to learn more about WIN-WIN Negotiation.
Process Map Library
This toolkit includes process map and best practice examples to aid teams in generating Process Improvement ideas. These examples were created by participants of MeHI's Change Management and Process Improvement workshops organized by MeHI from 2018 to 2020.
Be careful not to impose the examples on your team. That will be counterproductive, as process maps and best practices created by one team rarely apply to other teams. The main value of BRM comes from the discussions with your team. Don't undermine this by imposing other people's processes.
Select the "Process Map Library" tab to review the example process maps and best practices.
Process Selection
To get off to a good start with BRM Process Improvement, begin with a process that has strong change feasibility. This is a process where the change effort is relatively low, and the likelihood of success is fairly high. Manageable effort and success will motivate the team to continue with improving other processes.
Good candidates are smaller processes that are manageable in scope, have a manager who empowers the staff, and are executed by a team that is open to change. To be successful, everyone involved should have a sense of urgency and an interest to improve the process. These characteristics make it more likely for teams to perceive change as feasible and valuable, and to get on board.
The next sections discuss Process Selection tools that will help select processes that match these characteristics.
Change Feasibility Matrix
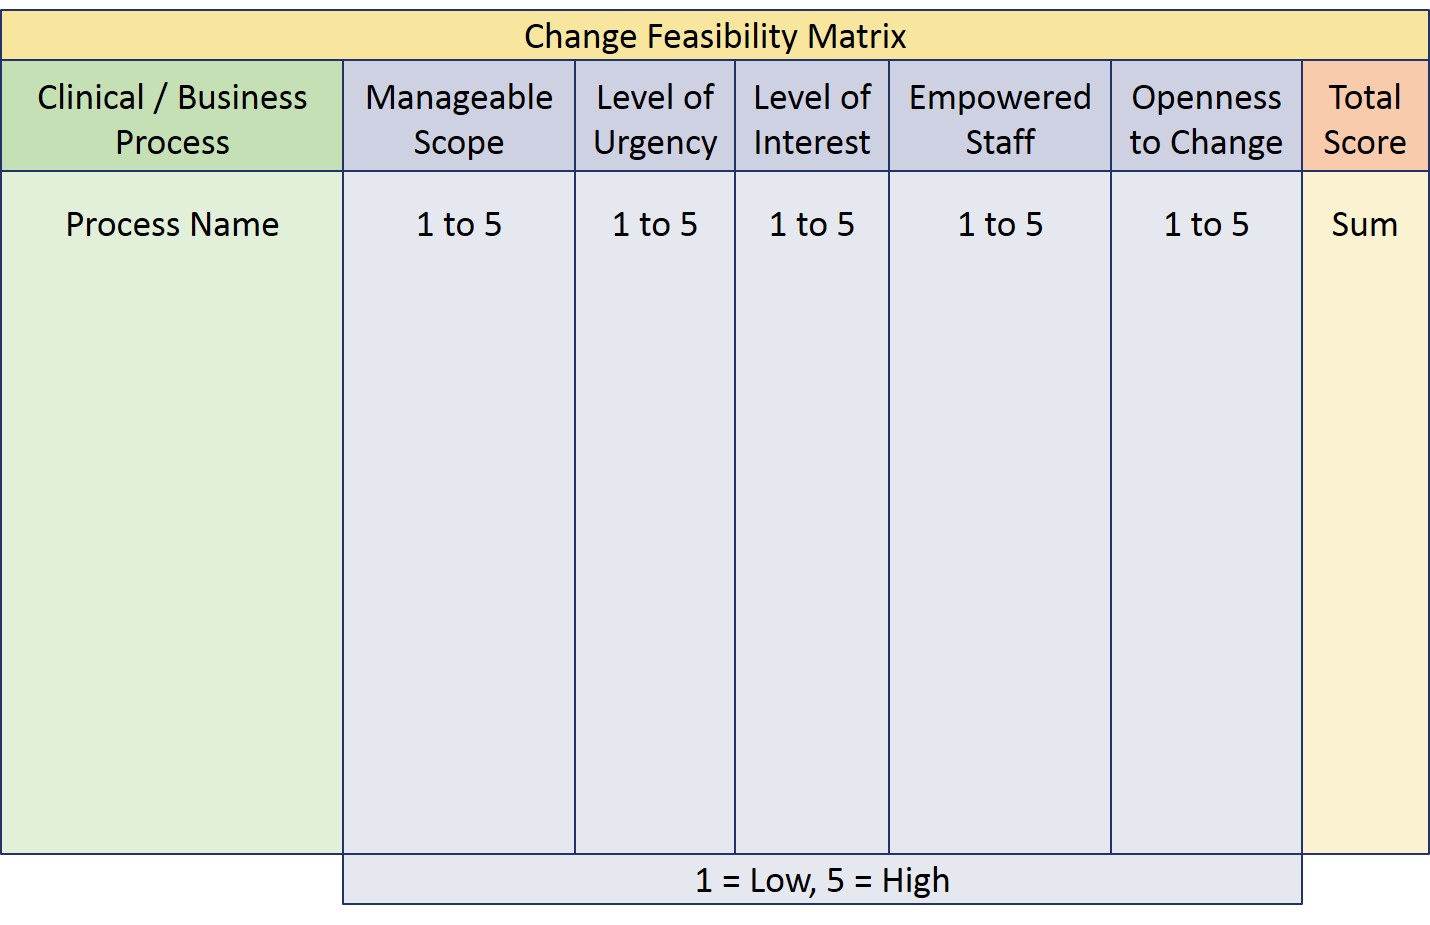
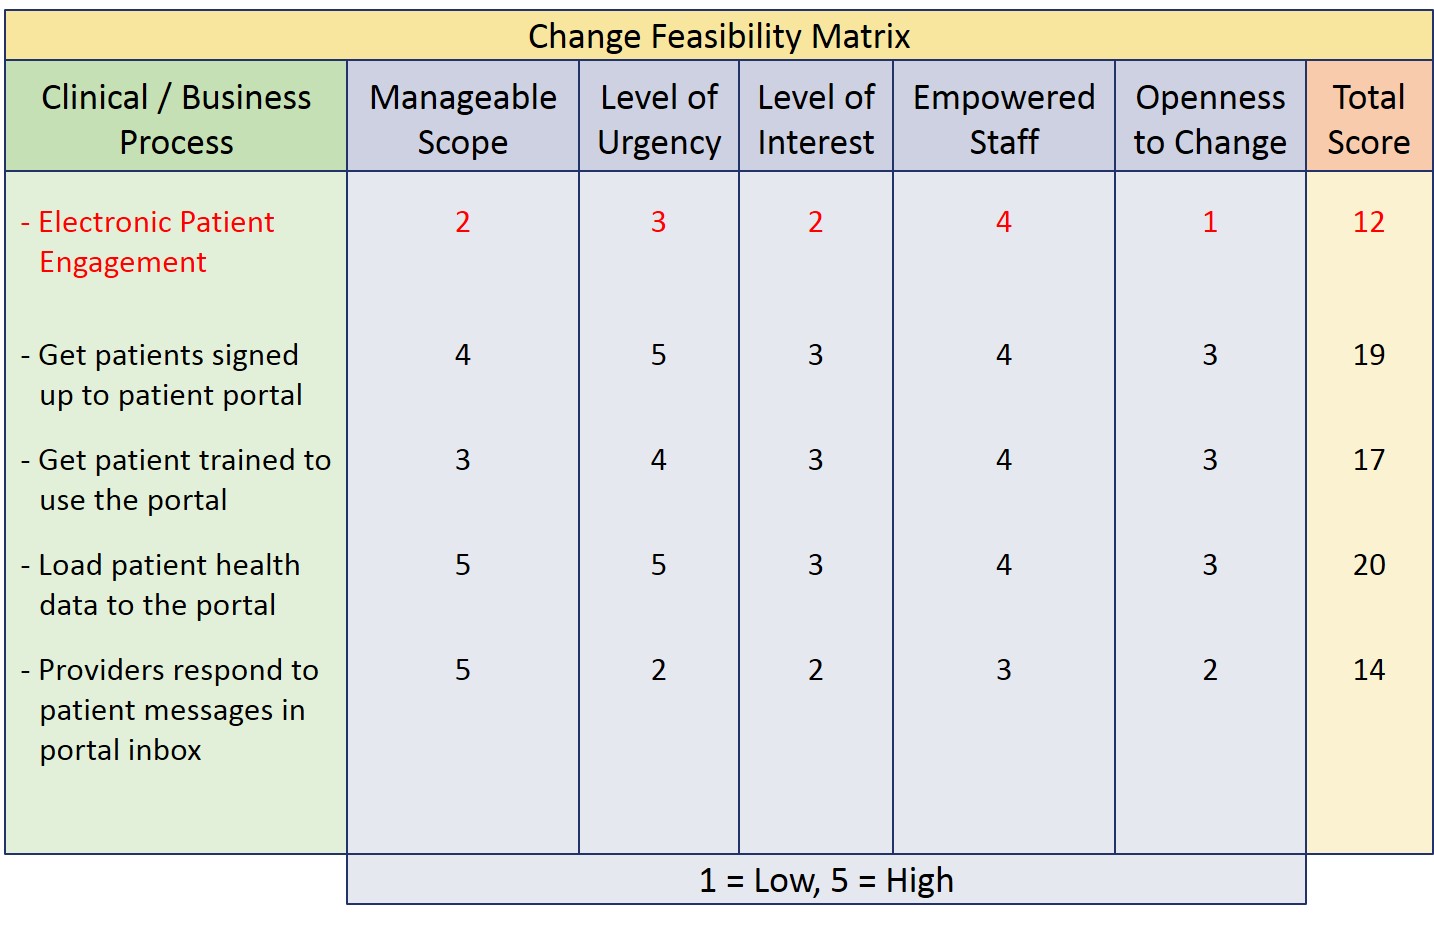
The Change Feasibility Matrix shown below can be used to rate existing processes based on the feasibility characteristics discussed above. Work with the team to:
- Brainstorm which processes the team may want to improve, and list these processes in the green column.
- Discuss how to score the change feasibility drivers of each process, and list these scores in the 5 blue columns.
- Sum the scores and list the total in the pink column.
From a feasibility perspective, the process with the highest total score is in principle the best candidate to improve first.
- If all processes have a low total score, break some processes up into sub-processes that may have a higher score.
Value Effort Matrix
A high change feasibility doesn't necessarily mean that Process Improvement will add substantial value. Just because change is easy, doesn't make it valuable.
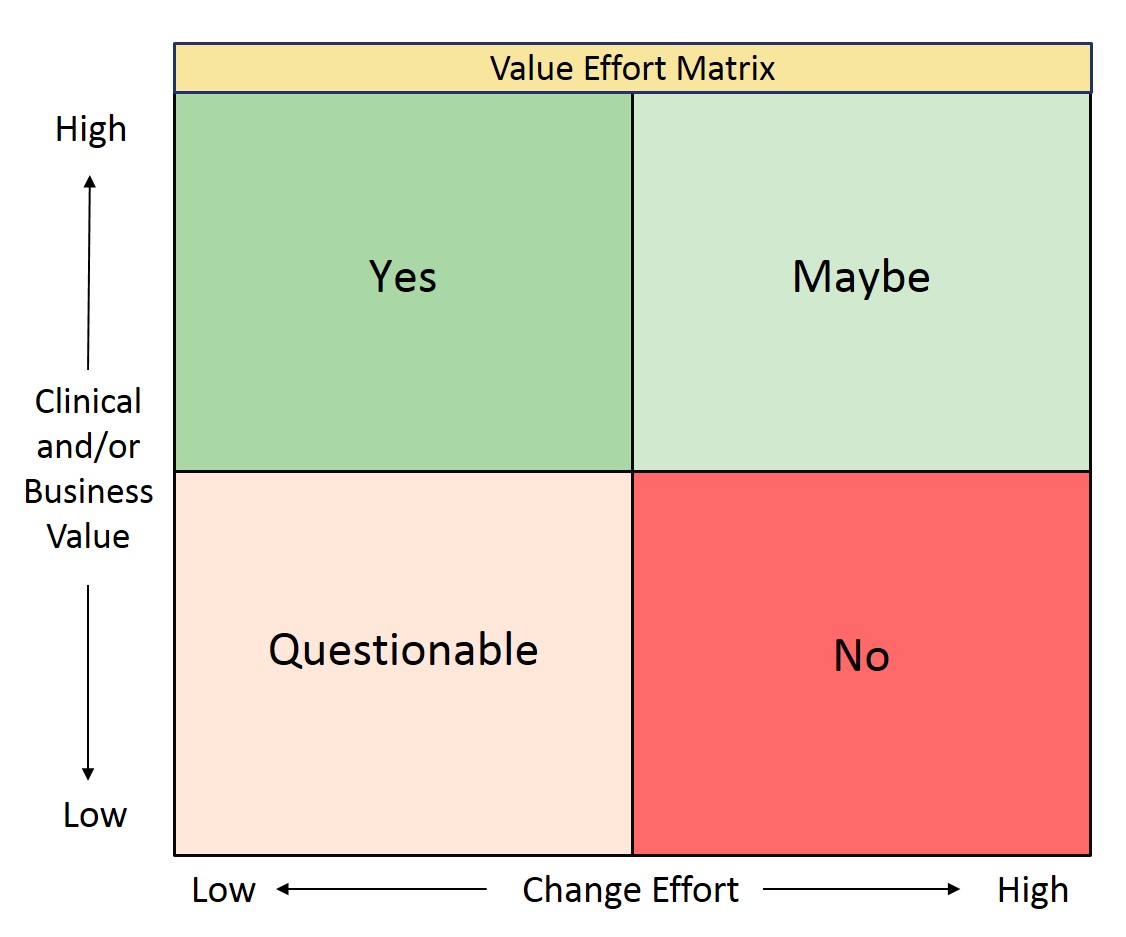
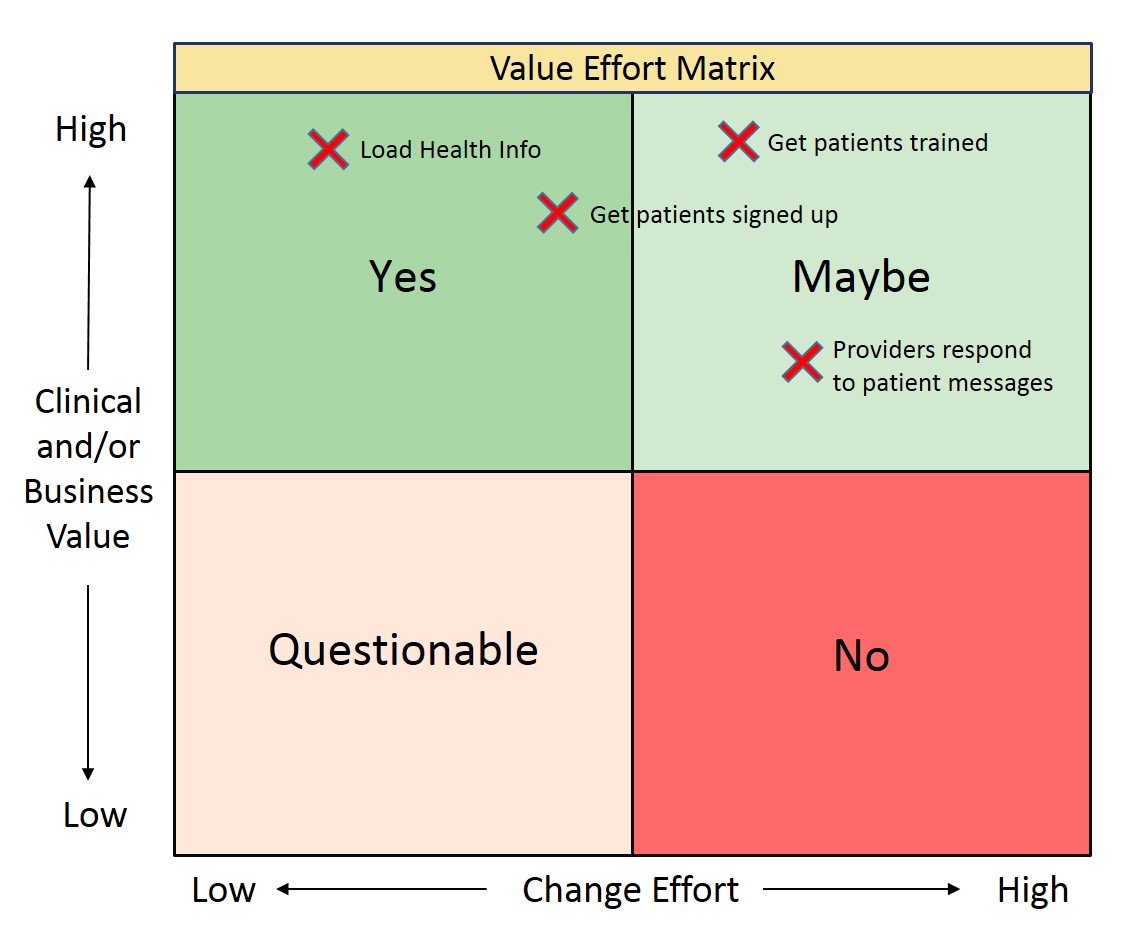
The Value Effort Matrix shown below can be used to further refine the Process Selection. The purpose is to evaluate the business value of improvement versus the change effort. Use the matrix to refine which process to improve first:
- Place the top candidates identified with the Change Feasibility Matrix above into the quadrants of the Value Effort Matrix.
- The value is higher if the improvement has a larger impact on the process outputs, customer satisfaction, or business financials. For instance, if it improves the clinical outcomes.
- The effort is inversely related to the total score in the Change Feasibility Matrix, meaning low feasibility correlates to more effort. For instance, effort is higher for complex processes with a large scope.
Once the processes are placed in the Value Effort Matrix, the matrix can be used to select the order in which to improve the processes:
- Processes in the dark green quadrant are the best candidates to improve first. The low effort and high value make success realistic and the impact significant. It is the low hanging fruit.
- Processes in the light green quadrant are the best candidates to improve next. The effort is higher, but it still comes with significant value. Be careful though not to start with processes that require a lot of effort.
- Processes in the pink quadrant can be improved third in line, but consider carefully before doing so. While the effort is low, the value is also low. Only improve processes where the value is at least reasonable.
- Improving processes in the red quadrant tends to be too complex and not impactful. This leads to wasted effort that might be better applied to further refine the other processes.
Example
The graphics below show an example of Process Selection. In this case, the team brainstormed an Electronic Patient Engagement (EPE) process. They first completed the Change Feasibility Matrix.
Originally, EPE was evaluated as a single topic, but the team realized that this was too complex. The total score was low. The scope wasn't manageable, there was little interest, and the openness to change was low.
In the next step, the team broke EPE into four smaller sub-processes of more manageable scope. When they realized a process can be broken into more realistic chunks, the interest and openness to change increased.
Three of the four sub-processes received a reasonable total feasibility score. The fourth sub-process still had a fairly low score, but this process was perceived as non-critical to initial success.
Subsequently, the team completed the Value Effort Matrix by placing the four sub-processes into the matrix.
Based on the matrix, the team decided to first map the sub-process to get patients signed up, and then the sub-process to get patients trained to use the portal. The team discussed that both processes should focus on patients who could benefit the most from the portal, such as patients with chronic conditions.
While the sub-process to load health information was seen to have the highest value/effort ratio, the clinically oriented team declined to map this process. They considered it an IT process that could be automated by IT.
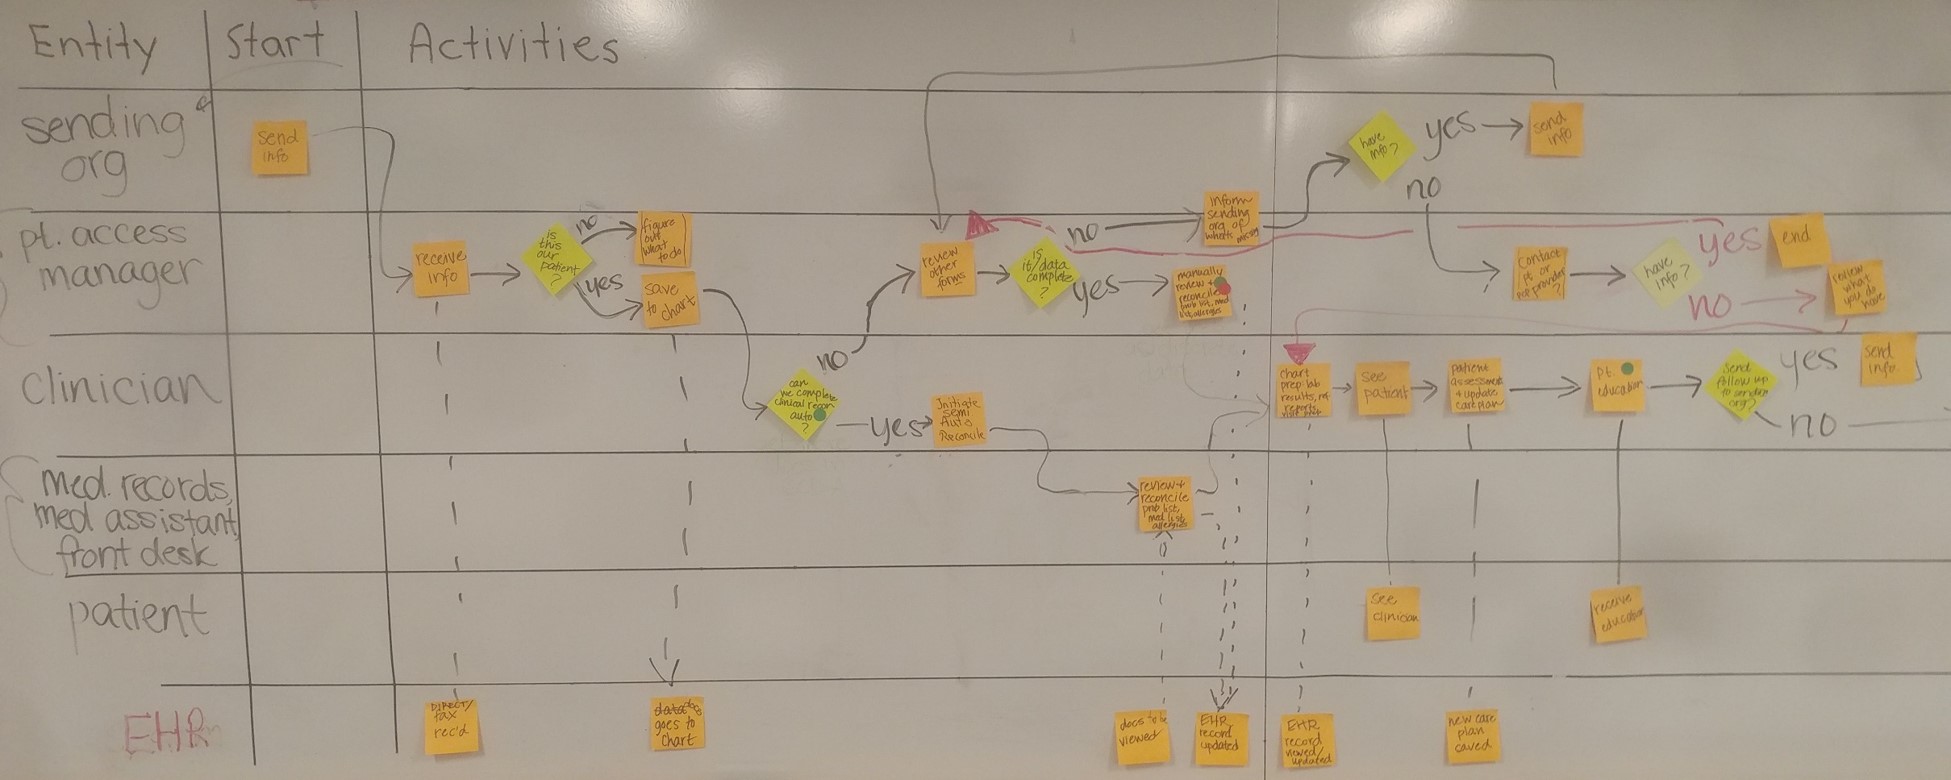
Subsequently, two process maps were created, which are included in the Process Map Library of this toolkit. The maps were actually created by two separate teams that both came to the same conclusion in their Process Selection. To review the maps, click here.
Process Mapping
Continue the BRM Process Improvement by organizing a Process Mapping session with the team to chart the selected process. Process maps are conducive to establishing insight into the process activities, the sequence of the activities, who executes the activities, and the hand-offs between the people and systems involved. This tab discusses how Process Mapping works.
The main goal of Process Mapping is to get everyone on one page to establish mutual understanding of the current process. It is typical for participants to experience Aha moments when they realize the process doesn't quite work the way they thought it worked. These moments often correspond to improvement opportunities, so make sure to take notes of such discrepancies.
However, wait until the process map has been completed before defining improvements, because that yields a clean starting point to begin the discussion on how to effectively improve the process.
Canvas
The process will be mapped on a canvas. Use a large whiteboard, or a series of sheets of easel paper taped to the wall as the canvas. During the discussion, write down the identified process activities on sticky notes and place them on the canvas. Draw arrows to connect the notes to show the execution order and hand-offs. The sections below provide detailed instructions on how to create the map.
Swim Lanes
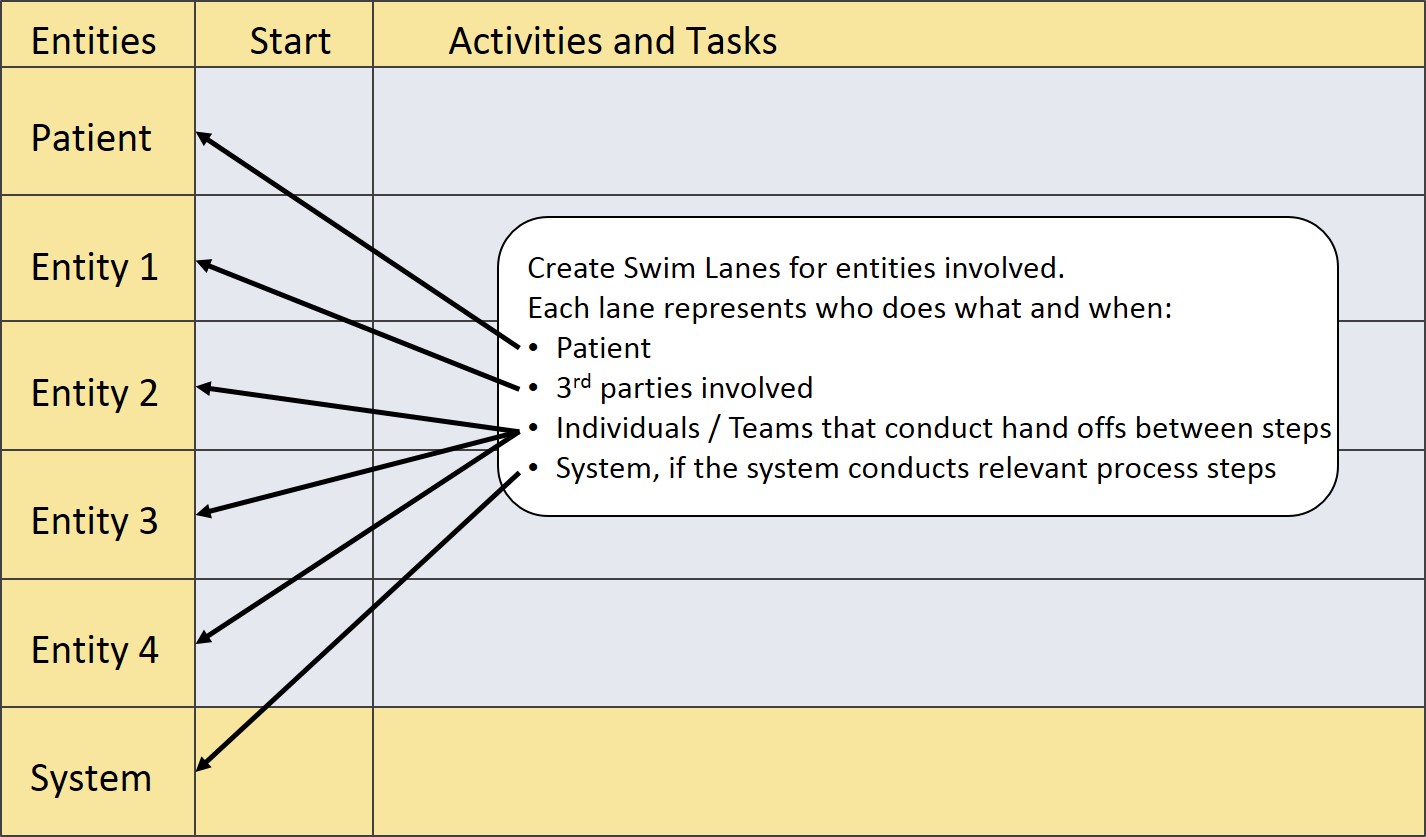
Draw swim lanes on the canvas. A swim lane represents an entity with a specific role in the process. Separating the entities is a key enhancement to traditional flow diagrams, where the entities are embedded within the flow. The swim lanes create a much clearer picture of who does what.
Use the swim lanes to map the activities and tasks that are executed by each entity. Each lane must correspond either to a single person, or a team of people who all execute exactly the same role. If there are differences in roles, use separate swim lanes. For instance, in a patient care process:
- the physicians, nurses, administrators, and anyone else affecting the care of a patient should be assigned separate swim lanes.
- the patients are engaged in the process, so the patients need their own swim lane.
- the care providers may interact with computer systems, such as an EHR. Because the systems fill a role, systems must also be assigned a swim lane.
Entity and Activity Columns
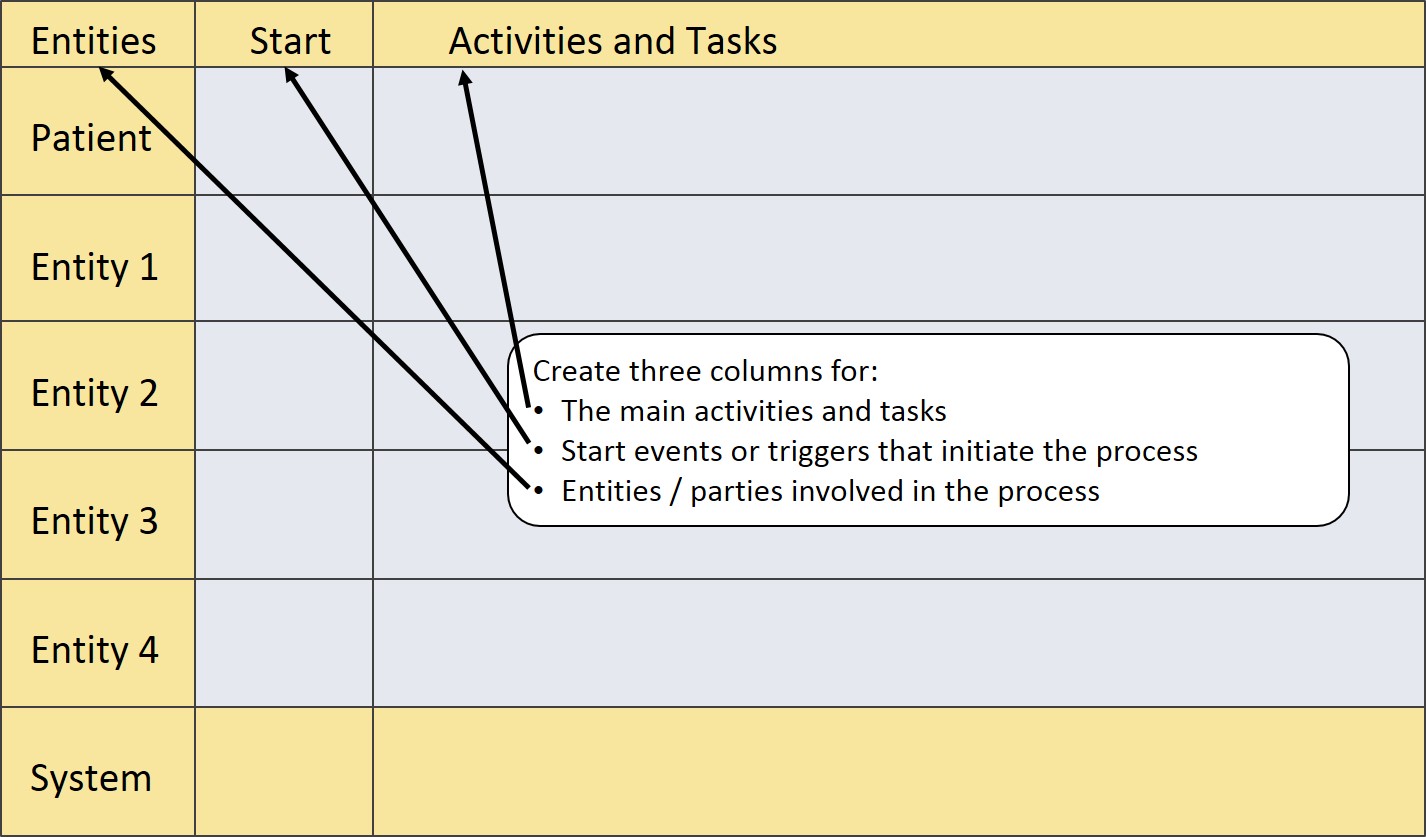
Draw three columns on the canvas. Use the first column to list a title or name for each entity involved, the second to highlight the activity that starts the process, and the third to map the activities, tasks and decisions executed by the entities.
Process Mapping Symbols
During the mapping session, use sticky notes to represent the activities and place each note in a swim lane based on the entity that executes the activity. Use markers to draw arrows to represent the process flow.
After the session, use a flowchart program to recreate the map electronically so you can share the map with the team. For instance, MS Visio can be used to document a process map as a "Cross-Functional Flowchart", which supports the swim lanes.
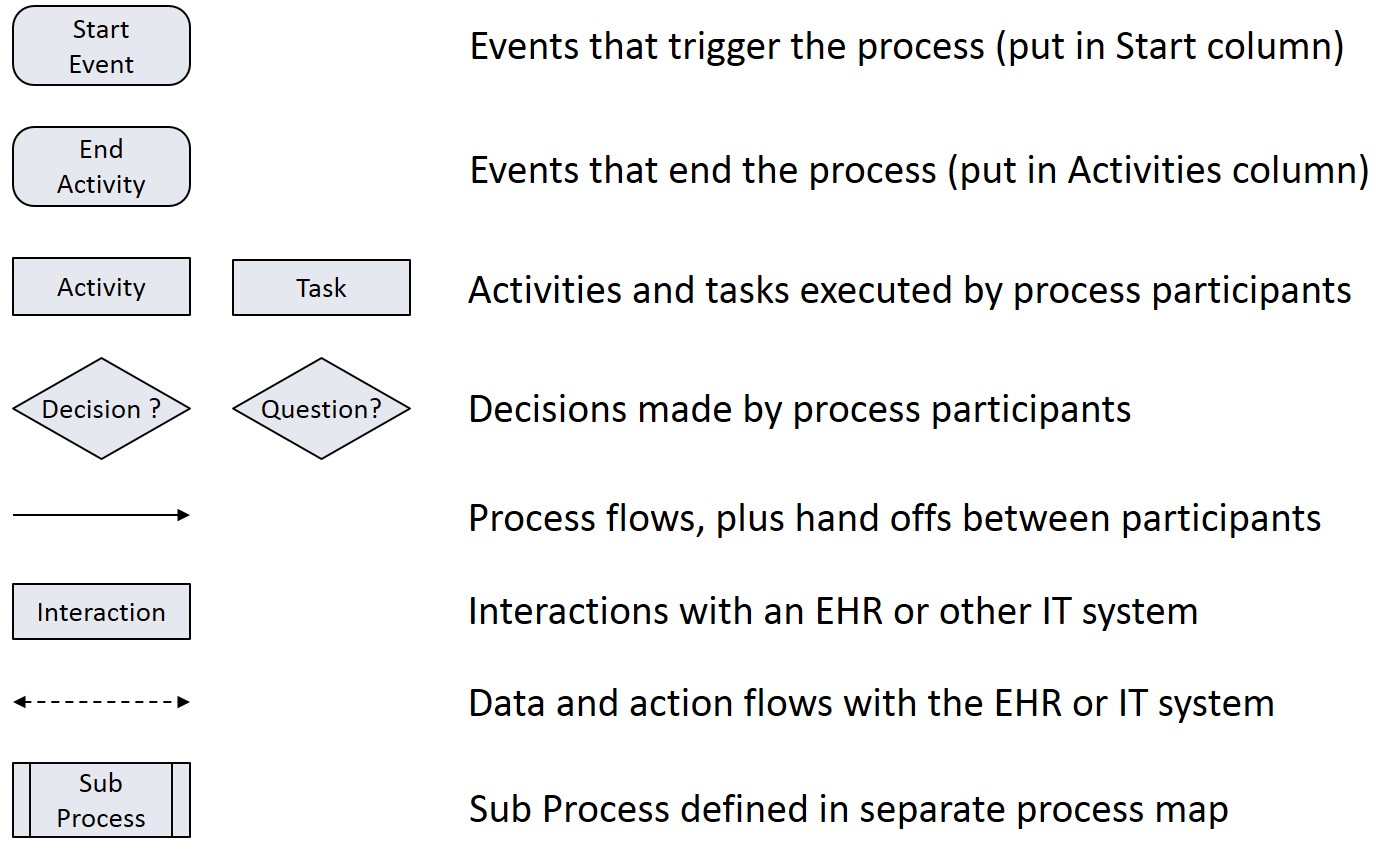
Flowchart programs use various symbols to layout the process flow. It isn't quite practical to use these symbols during a live Process Mapping session. The following sections describe how to use the symbols in a flowchart program, and how to use the sticky notes during a live session to match the electronic layout.
Activity and Task Symbols
In an electronic process map, use rounded boxes to show the triggers that start the process and any activities that end the process. Use rectangular boxes to show all other activities and tasks, and diamond shaped boxes for questions and decisions. Use solid arrows to show the order of activity execution, and the hand-offs between the entities.
During a live session, use sticky notes for all boxes, and use square notes tilted by 45 degrees as diamonds. Place only start triggers in the Start column. Place all other notes in the Activities and Tasks column. Draw arrows with a marker, but not until the team is sure of the execution order. Teams typically keep moving notes around, and add notes, during the discovery of how the process works.
System Interaction Symbols
In an electronic process map, use rectangular boxes to show activities completed by a system, e.g. an EHR. Draw the arrows between people and system activities as dashed lines, because interactions with a system usually represent data flows rather than activity flows. Except, if a system clearly automates part of the process, then draw the hand-offs between the system and people as solid arrows.
During a live session, use sticky notes for the boxes, and draw the arrows with a marker after the process flow is established. Most of these arrows should be dashed lines, unless there is automation involved.

Sub-Process Symbol
A process may be too complex to map out as a single process. In this case, it is better to map parts of the process as sub-processes. That keeps the main process map simpler and cleaner. In an electronic process map, use a special symbol to highlight the embedded sub-processes in the map. It looks like an activity box, but has two extra side bars.
During a live session, use sticky notes for the boxes and draw bars on the sides. When part of the process side tracks a mapping session with too much detail, it can be appropriate to suggest introducing a sub-process to park the detailed discussion until later.
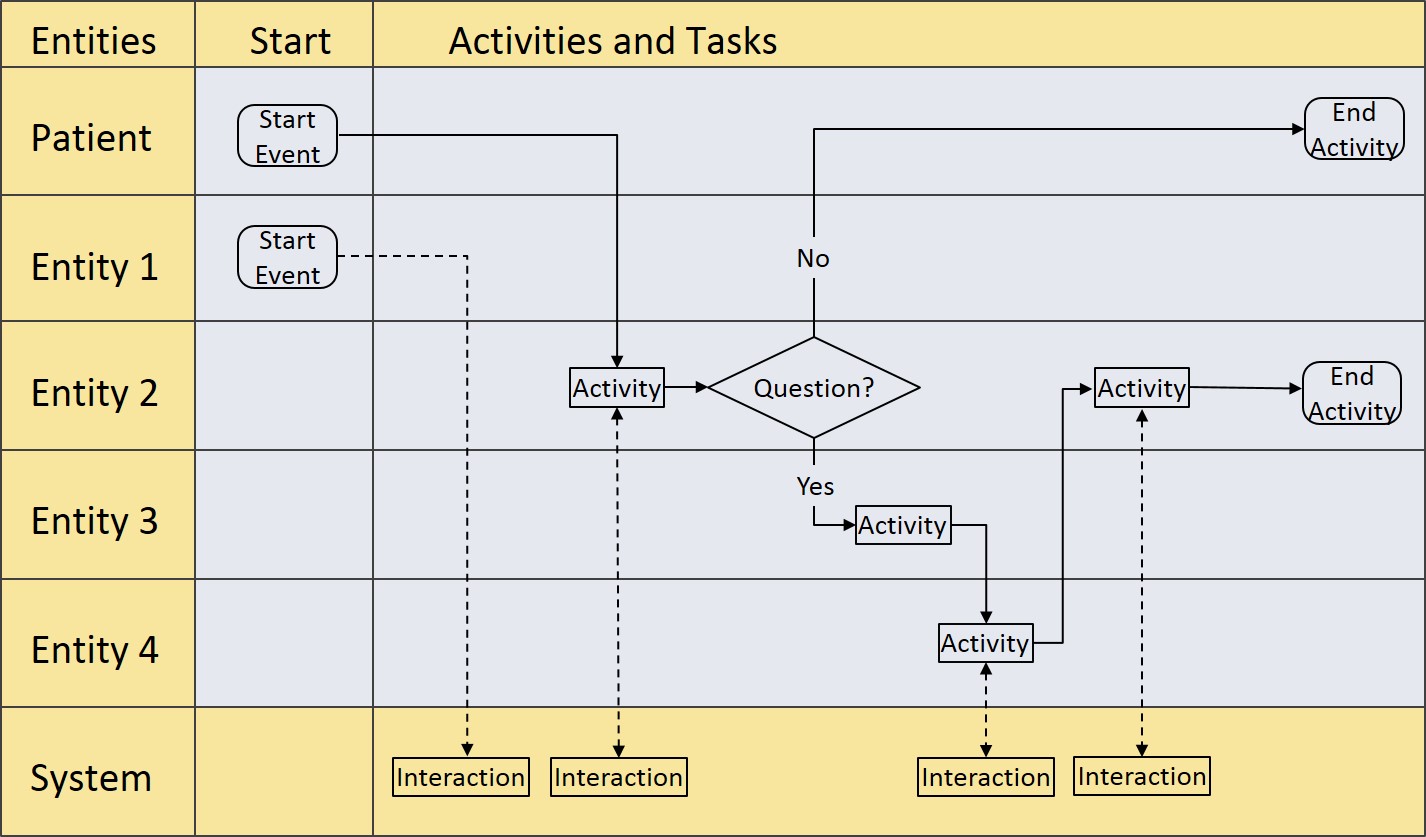
Layout of a Process Map
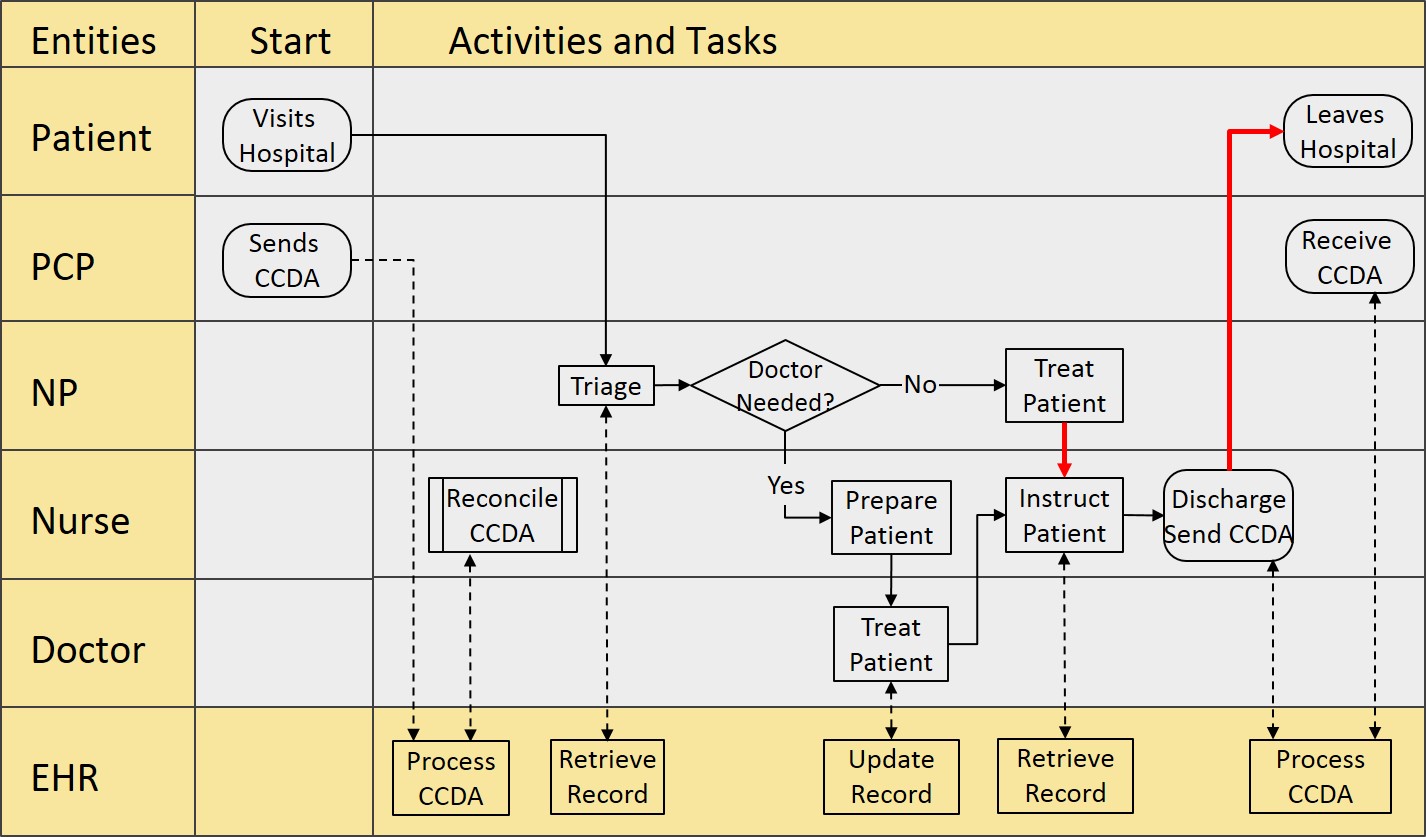
Following the above description, process maps typically look like the example shown below.
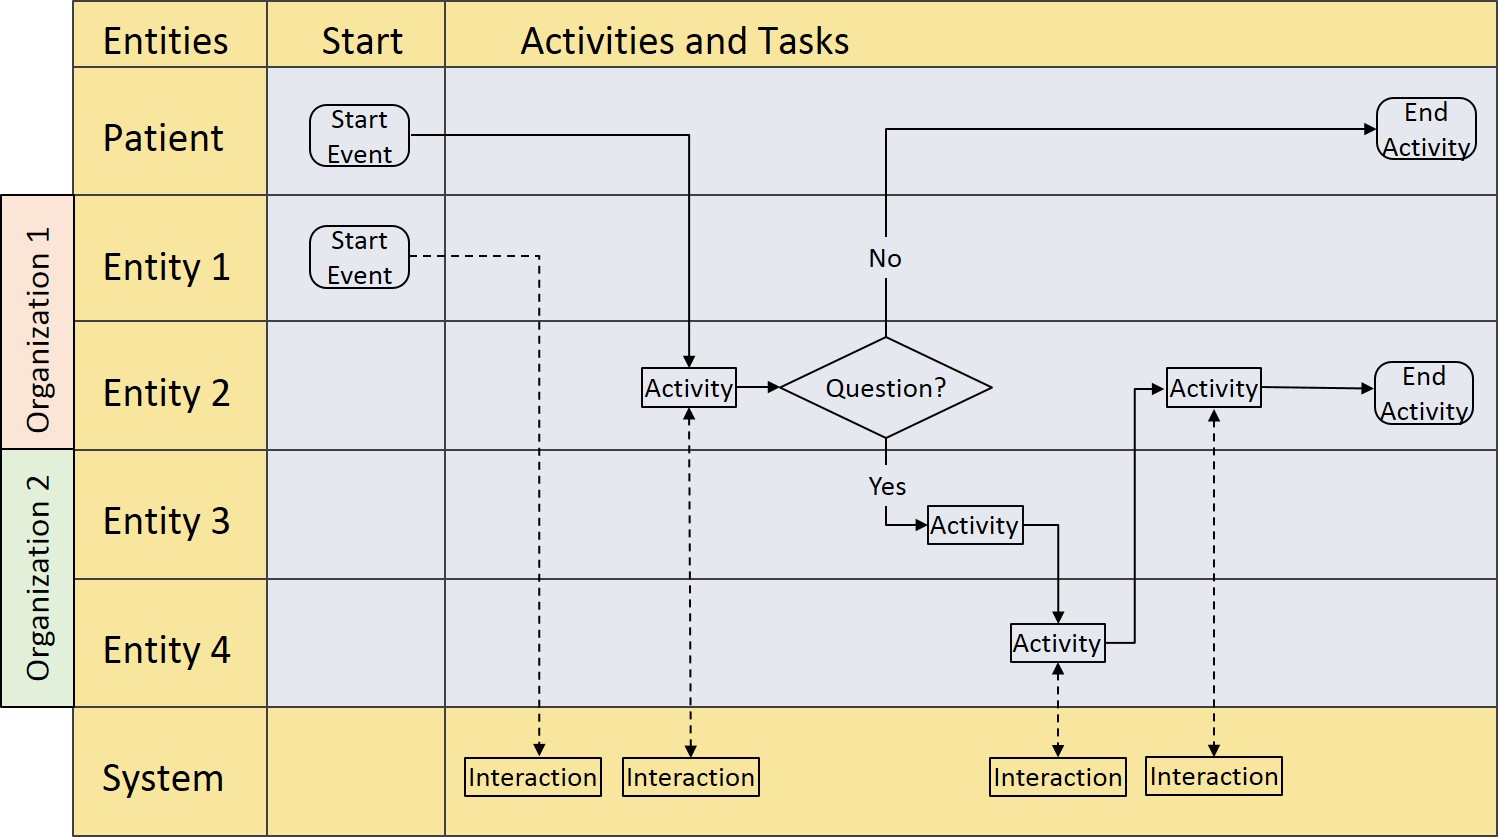
Processes across Multiple Teams or Organizations
Processes may run across multiple teams or organizations. In this case an extra column can be added in front of the map to clearly show the team or organization that each entity works for.
Process Mapping Rules
When making a process map, follow the key rules listed in the table below. These rules were designed to make the maps clear and efficient. There can be exceptions to these rules, but make sure that the map remains clear to the participants.
| Category | Rule | Description |
|---|---|---|
|
Sequence |
Create Timeline |
Treat the swim lanes as a timeline, so the process map shows the progression of the activities. |
|
Avoid Loops |
Minimize looping back from boxes on the right to the left. This appears to show rework, but confuses the timeline. Show rework as new activities down to the right. This also reflects that rework tends to differ from original work. | |
| Activities and Tasks |
Use Action Statements | Use clear action statements of what is being done in the activity or task. Action statements start with a verb. |
| Make Entities Unique | Action and task statements should never list the name of an entity. If this seems necessary, add more swim lanes. | |
| Use at least 1 Solid Incoming Arrow | There must be at least one solid incoming arrow. Use of multiple incoming arrows is allowed to reflect multiple paths leading to an activity or task, but maps tend to be clearer if this is avoided. | |
| Use 0 or 1 Dashed Incoming Arrow | Additionally, there can be one dashed incoming arrow coming from a system activity. This shows that data is retrieved from the system during the activity or task. | |
| Use only 1 Solid Outgoing Arrow | There should typically be one solid outgoing arrow. Adding more arrows makes it ambiguous what happens next. If this is necessary, add an activity that states why the process splits into multiple paths. | |
| Use 0 or 1 Dashed Outgoing Arrow | In addition, there can be a dashed outgoing arrow that leads to a system activity. This shows that the activity or task results in data being added to the system. | |
| Decisions and Questions |
Use Discrete Decisions or Questions | Use decision or question statements with discrete and unique answers, such as Yes/No. This ensures clarity in where the process flows next. |
| Make Entities Unique | Decisions or questions should never list the name of an entity. If this seems necessary, add more swim lanes. | |
| Use at least 1 Solid Incoming Arrow | There must be at least one solid incoming arrow. Use of multiple incoming arrows is allowed to reflect multiple paths leading to a decision or question, but maps tend to be clearer if this is avoided. | |
| Use at least 2 Solid Outgoing Arrows | There must be at least two solid outgoing arrows to reflect the possible decisions or answers. The decisions or answers must be written on or above the arrows. | |
| Use 0 Dashed In or Outgoing Arrows | There can be no dashed arrow going in or out of a decision or question. Add a leading or trailing activity or task to reflect the exchange with the system. |
Process Map Illustration - Part 1
The process map below illustrates how Process Mapping can be used to map out how a process works. The story behind this map is as follows:
- A Patient is referred by their Primary Care Physician (PCP) to visit a Doctor at a hospital.
- The PCP sends a C-CDA to the hospital.
- The C-CDA is received by the hospital's EHR and then reconciled in the system by a Nurse.
- When done, the Nurse creates a reconciliation report.
- When the Patient comes in, a Nurse Practitioner (NP) triages the Patient.
- The NP decides whether the Doctor needs to see the Patient:
If Yes:
- The Nurse will prepare the Patient to be seen by the Doctor.
- The Doctor will treat the Patient and then send him/her back to the Nurse.
- The Nurse will give instructions to the Patient and discharge the Patient.
- The Nurse will send a return C-CDA to the PCP.
If No:
- The NP will treat the Patient.
- The NP will then discharge the Patient.
- The NP will send a return C-CDA to the PCP.
- The Patient leaves the hospital.
- The PCP receives the C-CDA from the hospital.
Improvement
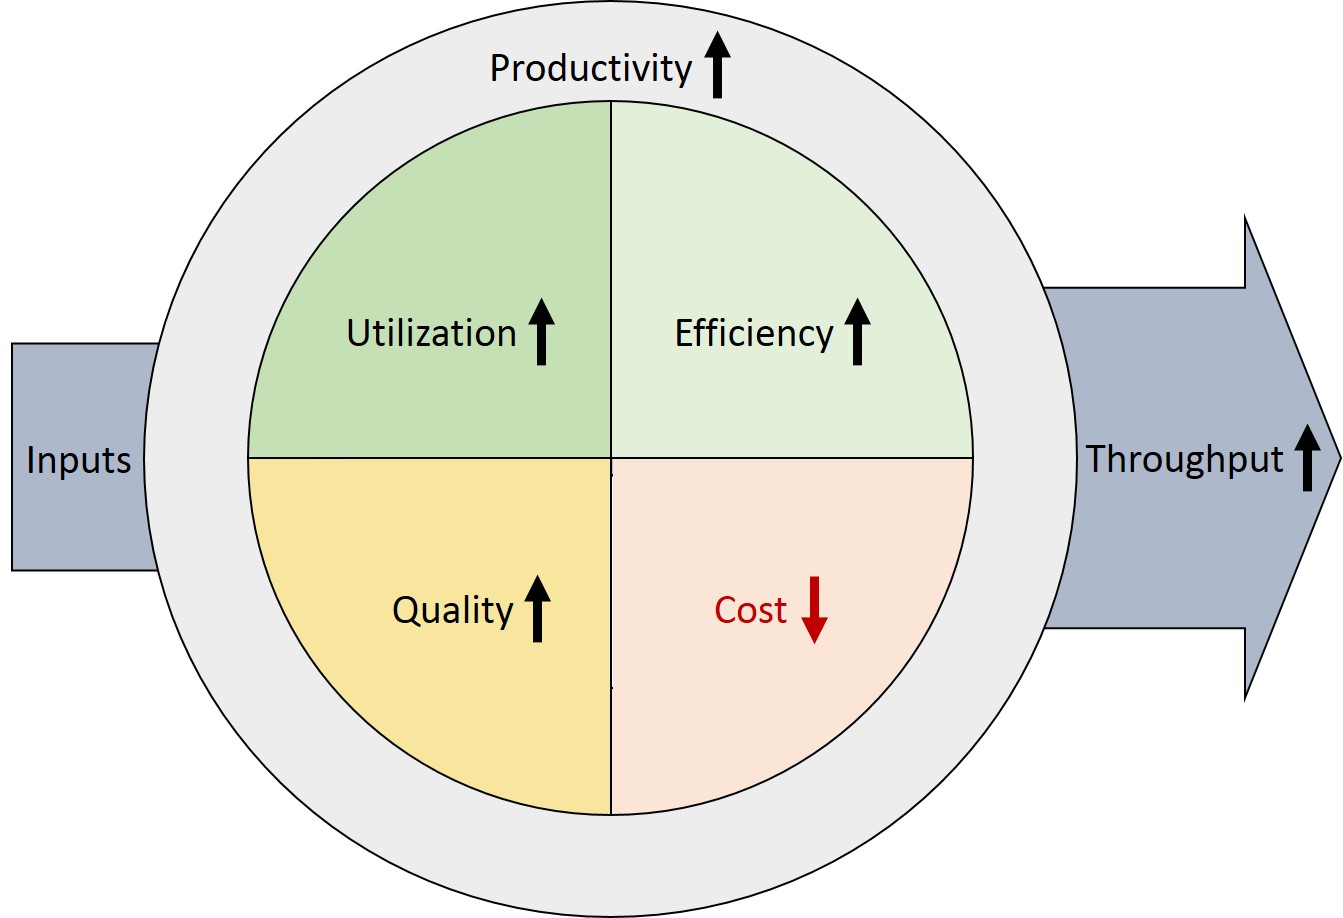
Once the current process has been mapped, the next step in the Bottleneck Resolution Method (BRM) is to improve the productivity of the process. Productivity is defined by the quantity and quality of the process outputs versus the cost of producing those outputs. The goal is to increase the profitability and impact of the process by increasing the productivity.
This goal requires increasing the quantity and quality and/or decreasing the cost. To accomplish these objectives, BRM uses concepts from the Theory of Constraints (TOC), Lean, and 6 Sigma, to the extent practical for teams with limited Process Improvement expertise. The graphic below shows the concepts that are incorporated.
BRM resembles TOC in that it first and foremost focuses on resolving bottlenecks, which are constraints that stop a process from producing more outputs. The priority is to find and resolve the biggest bottleneck. The next priority is to find and resolve the next biggest bottleneck, and so on. Bottlenecks are resolved by deploying alternate people, systems, methods, and workload distributions.
BRM integrates Lean's concept to eliminate superfluous activities that don't add value, and 6 Sigma's concept to reduce quality problems that cause rework activities. As non-value-add and rework activities take up time, they lower the output quantity and increase cost. Eliminating these activities frees up time that can then be used to resolve bottlenecks.

The remainder of this tab contains two chapters. The first chapter defines the key productivity drivers addressed by BRM. The subsequent chapter explain the BRM framework for improving productivity, which relies on a reasonable understanding of the productivity drivers.
Productivity Drivers
This chapter explains the key productivity drivers addressed by BRM, including throughput, bottlenecks, bottleneck resolution, utilization, efficiency, quality, and cost. This chapter also explains the relationship between these drivers and productivity.
Throughput
BRM's main focus is on increasing throughput. Throughput is defined as the output quantity produced over a defined period of time. For instance, 20 units per hour. Improving the output quantity of a process requires increasing the throughput of the process.
The process throughput is determined by the throughput of the activities that make up the process. Each activity has a maximum throughput, i.e. the maximum amount the activity can produce. If every activity in a process is executed in sequence to produce one unit of output, then the process can only produce as many units as the activity with the lowest throughput can produce.
For instance, assume process ABC consists of 3 activities A, B, and C to be executed in sequence to cure a patient. Assume the maximum throughput of A = 20 patients/hour, B = 10 patients/hour, and C = 20 patients/hour. The maximum throughput this process can produce is defined by B, which is 10 patients/hour.
This example is visualized below. The area between black lines represents the maximum throughput of activities A, B, and C. The yellow arrow visualizes the maximum process throughput as limited by activity B.
Bottleneck Resolution
To increase throughput, BRM focuses on resolving bottlenecks. A bottleneck is defined as a limitation or constraint in the process that restricts the overall throughput. Bottlenecks are inversely related to throughput. The activity with the lowest throughput is by definition the biggest bottleneck.
In the example above, activity B is a bottleneck, because it limits the throughput of the process to 10 patients/hour. If activity A would handle 20 patients/hour, this would create an inventory of partially cured patients queuing up in front of activity B. Activity C can never even cure 20 patients/hour, as it never receives more than 10 patients/hour from activity B.
If you could double the throughput of activity B, the process throughput would increase accordingly. This would eliminate the bottleneck from activity B, as shown below. This could for instance be accomplished by simplifying the activity so it takes less time, or by assigning additional resources to increase the capacity.
Processes often have multiple resources to accomplish the same activity. In this case, the combined throughput of the resources that execute an activity determines the overall throughput of the activity. For instance, multiple people and/or machines can execute the same activity, which is visualized below. In this example, the two people who execute activity B are the bottleneck.
Bottleneck Resolution Order
The core principle of BRM is to use the process map to determine the activity that causes the largest bottleneck, and to resolve this bottleneck first. This will typically cause another bottleneck to become the biggest, and that one should be resolved next, and so forth. This is shown below.
Don't aim to resolve all bottlenecks. There will be a diminishing return on the effort as the remaining bottlenecks will be smaller. The 80 20 Pareto rule applies: By first focusing on the biggest bottlenecks, resolving 20% of bottlenecks might resolve 80% of the throughput issues. This opens the door to keep things practical:
- Don't take "biggest" bottleneck too literally. Without measuring all the activity throughputs, which may not be feasible, it may not be clear what the biggest bottleneck is. Even if you can determine the biggest bottleneck, it might not be practical to resolve it first. The essence of "biggest" is to resolve bottlenecks where improvement will significantly increase the process throughput.
- Don't take "resolution" too strictly either. It is not necessary to fully resolve the biggest bottleneck. It can be sufficient to resolve the bottleneck to the extent it is no longer the biggest. Thereafter, it may be more productive to first resolve other large bottlenecks that have become the biggest.
Utilization and Efficiency
The main drivers of throughput are the utilization and efficiency of the resources deployed to execute the process activities. Bottleneck resolution largely focuses on increasing the utilization and efficiency of both the human and system resources.
- Utilization: is defined as the percentage of time a resource is busy executing their assigned process activities and other required business responsibilities. Utilization is a quantifiable measure. For instance, if the utilization of a physician is 80%, he/she spends 80% of the time on required activities. The remaining 20% is excess capacity available to be deployed elsewhere in the process.
If the utilization of a resource reaches 100%, the resource will likely become a bottleneck, unless the resource starts working overtime, which might be cost effective. For instance, if the cost of overtime is less expensive than adding people, allowing paid overtime can be an appropriate choice to avoid a bottleneck, but a better option would be workload redistribution.
Utilization often says little about whether a resource is efficient. A person that is 100% utilized might be inefficient in executing their tasks. For instance, young physicians may have a higher utilization than experienced physicians, but they are typically less efficient. Don't be fooled by high utilization, as sometimes people can be quite busy accomplishing little.
Bottlenecks inherently reduce the utilization of resources that execute activities that follow the bottleneck, because the bottleneck won't let enough output come through. So it is important to investigate who or what is the cause of low utilization. Is it the activity resource itself, or is it caused by a prior activity.
- Efficiency: is defined by how effective a resource is in executing their work. Efficiency can be quantified as the amount of work completed per time period spent on an activity. For instance, if a resource produces 100 units/hour and its utilization for this task is 50%, the efficiency of the resource for this task is 200 units/hour.
Both non-efficient and efficient resources can cause bottlenecks. Obviously non-efficient resources are more likely to cause bottlenecks, as non-efficiency reduces throughput. However, if the utilization of a resource is high, even an efficient resource can become a bottleneck as there simply isn't sufficient time in the day.
For resources that handle many different activities, the efficiency tends to be less measurable, as the outputs consist of many things. In this case, efficiency becomes a relative measure based on a subjective assessment. For instance, is the person focused on their tasks, how much does the person produce versus others, do the various outputs require a lot or little effort?
Quality and Cost
While BRM's main focus is on increasing throughput, the goal of BRM is to improve productivity, which is defined by the relationship between quantity, quality, and cost. High quantity and quality at low cost is productive, and low quantity and quality at high cost is unproductive.
There is no point in producing a large quantity if this comes with many quality defects, or at a cost that is too high. Just because people are efficient, doesn't guarantee they produce quality outputs, or vice versa. If doing it right the first time means doing it slowly, or with expensive resources, that isn't effective.
In other words, quantity, quality, and cost are related and cannot be improved in isolation. So when resolving bottlenecks to improve utilization and efficiency, take into account that all activities affect the output quality and that all activities come at a cost:
- Quality: can be expressed as the accuracy and precision of the outputs: Accuracy is defined as the average quality produced compared to the output specifications. High accuracy means the average quality meets specifications. Precision defines whether the quality is all the same (regardless of accuracy). High precision means the outputs are consistent in quality.
- Cost: is a function of Cost of Goods, Activity Cost, and Overhead Cost: Cost of Goods (CoGs) is the cost of materials that end up in the outputs. Activity Cost is the expense of resources and consumables deployed to execute the activities. Overhead Cost is the expense of related management, administrative and other overhead that doesn't add direct value to the outputs.
Productivity
To summarize, BRM defines productivity as the product of utilization, efficiency, quality, and cost. These four aspects are the main drivers to improve the process productivity at top level. Ideally, the aim is to drive utilization, efficiency, and quality up, and to drive cost down. However, the ideal solution may not be pragmatic and being pragmatic is important, otherwise the improvements might not succeed.
Being pragmatic requires making choices and introducing trade-offs. Sometimes it may be better to drive one aspect up at the expense of another aspect. For instance, when improving the efficiency, utilization can initially go down. Driving quality up too far can be overly costly, so good enough quality might be sufficient and more cost effective.
The remaining chapter on this tab defines the details of how to implement the BRM strategy. The main focus is on improving utilization and efficiency, but with a secondary focus on improving quality and cost.
There are typically many aspects at lower levels that influence these four main productivity drivers. To choose the right Process Improvement options, it will likely be necessary to dig deeper into what influences these drivers. Details of what aspects to look for are discussed in the implementation chapter below.
Productivity Improvement Framework
The sections below describe BRM's framework for improving productivity. The framework consists of three steps that expand on Process Mapping to define the improved future process. Steps 1 and 2 can typically be executed at the end of the Process Mapping session. Step 3 is best done later in a separate Process Improvement session.
The framework is intended as a resource to design real life improvements. The team will need to adapt and expand the options described in the framework to negotiate how the process will be improved. The "Negotiation tab" provides a negotiation strategy that is suitable for this purpose.
A word of caution for negotiating the improvements: Don't aim to design an ideal process. The objective is to define a pragmatic process that the team can actually make work, and that other stakeholders will support.
Step 1: Identify Bottlenecks, Non-Value-Add Activities, and Rework
The first Process Improvement step is to identify bottleneck, non-value-add, and rework activities. Finding these activities is key to improving the process with BRM. At the end of the Process Mapping session reevaluate the map of the current process and identify such activities. Look for the characteristics listed in the table below.
For the identified problem activities, determine whether they occur frequently enough to significantly lower the productivity. Ideally one should measure the impact, but teams can typically express whether things happen frequently and whether that causes major issues. As a first pass, this is sufficient to establish reasonable certainty whether there is a real issue or not.
| Activity | Identifying Characteristics | |
|---|---|---|
|
Explicit Bottleneck |
This activity causes wait queues and delays in front of the bottleneck, and idle time in the subsequent activities, while the bottleneck is busy at all times. For instance, if nurses can't keep up with preparing patients for surgery, the waiting room fills up with patients, and a surgeon may be idly waiting for patients. These are signs that the nursing activity is a bottleneck. |
|
|
Hidden Bottleneck |
This activity causes idle time in the activities before and after the bottleneck, while the bottleneck is busy at all times. This can happen when the activity before the bottleneck has been adapted to lower its output to avoid wait queues before the bottleneck. For instance, if the patient intake is adapted to the workload the nurses can handle, the nursing activity is still a bottleneck. |
|
| Non-Value-Add |
This activity produces things that add nothing to the outputs, aren't used by any other activity, and aren't needed to fill any legal or administrative business requirements. For instance, if two activities are located far apart and the outputs need to be transported from one activity to the other, the transportation adds no value if it could be avoided by co-locating the activities. |
|
| Rework |
This activity is executed to resolve quality issues, such as failures, errors, incompleteness, and other issues that cause variations in the process outputs. For instance, if Summary of Care (SoC) documents sent by a provider are frequently incomplete and require requests for updates, the activity to request and evaluate the updates is a rework activity. |
|
Step 2: Identify Productivity Improvement Opportunities
An easy way to resolve bottlenecks is to add resources. For instance, hire extra staff or buy an extra machine. This method is often used and frequently abused. It really should be the last resort after all Process Improvement opportunities have been exhausted. Adding resources, especially staff, is costly. It can also be ineffective and reduce capacity, for example when a lot of training is required.
Therefore in Step 2, first identify opportunities that improve the process without adding resources. Discuss ways to build on things that already work well. Look for opportunities to redistribute the workload or to use alternatives that improve the productivity of the existing resources. Step 2 is about identifying opportunities, and not about selecting the implementation, as that is done in Step 3.
Use the qualitative indicators in the list below to identify potential productivity improvement opportunities in the process map. The list is not exhaustive, but gives an idea of how to go about Step 2. The cost indicators overlap with the utilization, efficiency and quality indicators, because cost is an important aspect in making the right choices to improve the other three productivity drivers.
| Productivity Improvement Opportunity Indicators | ||
|---|---|---|
| Driver | Indicator | Description |
|
Utilization |
Frequently idle |
If resources are frequently idle this indicates that there is unutilized capacity that could be used for another activity. For instance, if nurse practitioners have idle time with nothing to do, this time could be made available to resolve that doctors have too much to do. |
|
Parallelism |
If the same activity is executed by multiple people in parallel, this indicates that there may be potential to move capacity between these people without training. For instance, if certain activities can be executed by both a nurse and a nurse practitioner, tasks can be shifted from one to the other depending on who is available. | |
| Repetitiveness | If an activity is repetitive, fully or partially automating the activity could be an option. For instance, the manual creation of the same daily report could be replaced with an automated report to free up people capacity through a one time investment in software. | |
| Efficiency | Ineffectiveness | If a resource is ineffective in their work, there may be room to improve how or by whom the activity is executed. For instance, if a nurse isn't great at report writing, simplifying the report, training the nurse in report writing, or giving the task to someone else might resolve the inefficiency. |
| Simplicity | If an activity is easy to execute, there may be potential to move the activity to somebody less skilled. For instance, if the physician handles patient issues a Nurse Practitioner (NP) could handle, these tasks could be shifted to the NP to free up the physician's time for more complex issues. | |
| Complexity | If an activity is too complex for a person's capability, it can be better to either move it to somebody more skilled, or to simplify the activity. For instance, if the nurses struggle with a task and it takes too long, maybe the NPs could handle the activity more effectively, or the task could be simplified. | |
| Quality | Rework | If there is rework, the activities that cause the rework should be improved. For instance, requests for updates to incomplete Summary of Care documents could be resolved by improving the quality of the information exchange process between providers. |
| Inconsistency | If there is inconsistency in how a process is executed, this can result in quality discrepancies in the outputs. For instance, if a person is inconsistent in their execution, or if multiple people execute the same work differently, this can result in variations in the output. Inconsistency can be harder to discover during Process Mapping than rework. | |
| Cost | Under-utilization | Under-utilization makes resources relatively more expensive. Increasing their utilization will reduce the cost per output, even if this means using them to execute simple tasks. This can be cost effective if there isn't enough complex or unique work to keep them busy. |
| Misappropriation | If resources are assigned to tasks that could be handled by less expensive resources, reassigning these tasks might reduce the cost. However, that isn't the case if that simply makes the more expensive resources under-utilized, so in parallel more complex work should be assigned to them. | |
| Ineffectiveness | If a resource is ineffective, the time spent on executing their work will be excessive and this increases the cost per output. Either train or coach the resource to become more effective, or reassign tasks between resources to align the work to their capabilities. | |
| Inconsistency | If resources are inconsistent in their execution, this can cause quality problems which inherently will cause rework or repair cost. Either train or coach the resources to become more consistent, or reassign tasks between multiple resources to align the work to their capabilities. | |
Step 1 and 2: Add Colored Dots to the Process Map
A good way to record the issues and opportunities in the process map is to place colored dots where they occur with a note of what was identified. These dots will aid in the Process Improvement Step 3 that follows. Use different colors for the bottlenecks, non-value-add activities, rework, and opportunities.
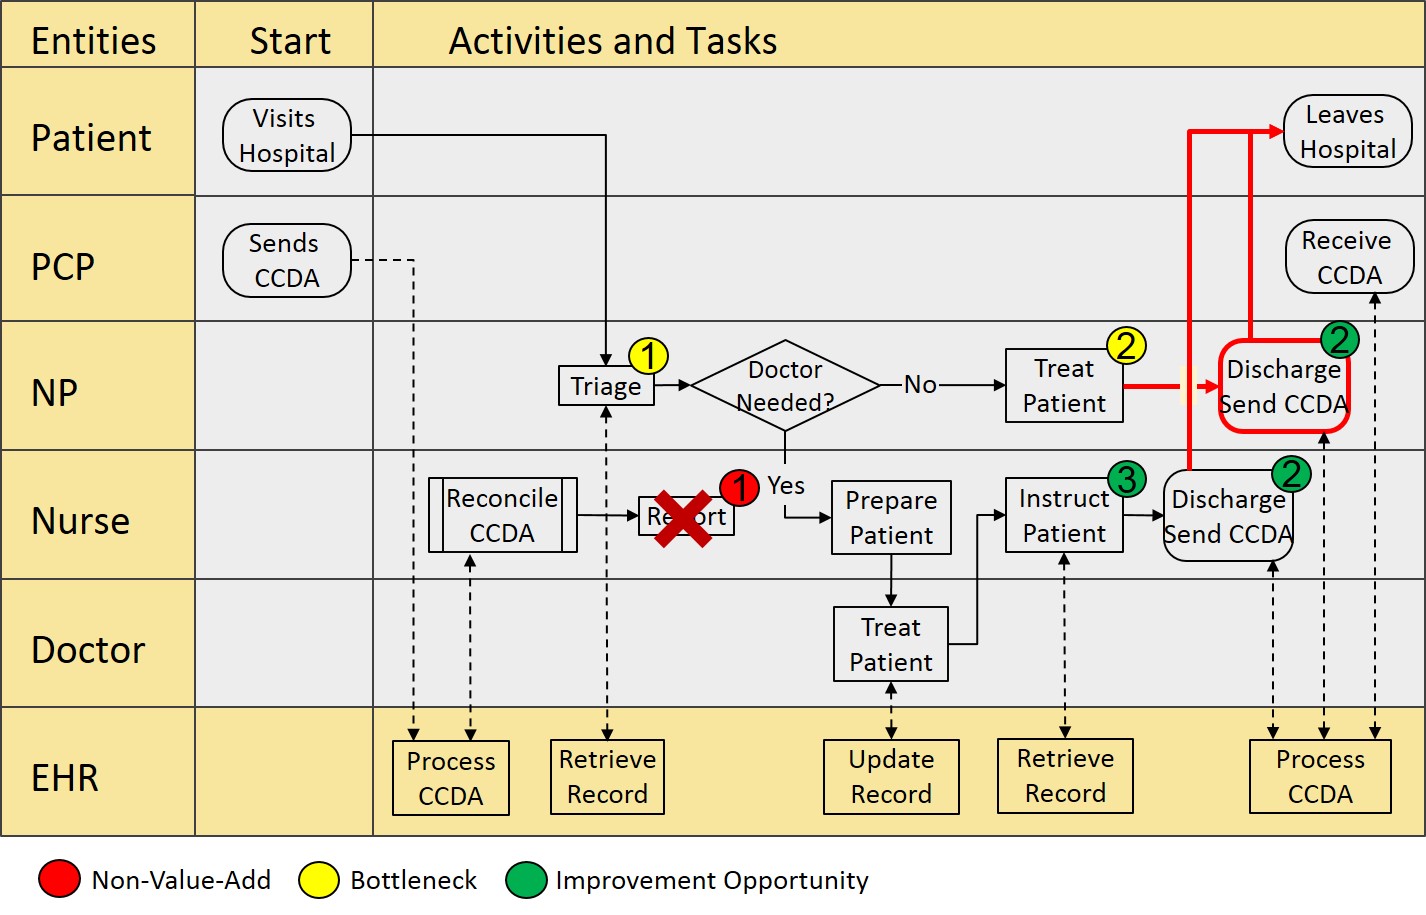
Step 1 and 2: Process Map Illustration - Part 2
Let's go back to our process map illustration shown at the end of the "Process Mapping" tab. Assume that the following observations were made, which are highlighted in the map below with colored dots:
Bottlenecks:
- The NP struggles to keep up with conducting the triages, causing a wait queue of patients.
- The NP also can't keep up with treating patients.
Non-Value Add:
- The reconciliation report created by the Nurse is not used by anyone, because others can see the reconciliation within the patient's EHR record.
Resolution Opportunities:
- Reconciling the C-CDAs could be partially automated.
- Discharge C-CDAs are sent by the NP, but the Nurse is capable of doing that too. Could the Nurse handle the NP's discharges?
- The Nurse instructs the patients seen by the doctor. This probably implies that the NP instructs her own patients even though this isn't shown in the map. Since instruction takes up NP time, could the Nurse handle the NP's instructions too?
Note: These last two opportunities assume that the Nurse has time to handle this extra work, and/or that Nurse time can be freed up to handle these tasks. Before the process can be improved, this needs to be verified. How to potentially do that with metrics is the topic of the "Productivity Metrics" tab.
Step 3: Resolve Bottlenecks, Non-Value-Add Activities, and Rework
The next step in the Process Improvement is to determine how to best resolve the identified issues. In Step 3, bottleneck resolution is the main priority, but the value-add optimization and rework/variance reduction are secondary objectives executed in parallel.
Schedule a Process Improvement session with the team to discuss how the process will be improved. Let them suggest how it can be done as that increases buy-in and enables motivation to make it work, but stimulate them to build on what already works rather than reinvent the wheel. Update the process map based on the agreed upon improvements to reflect how the process will work going forward.
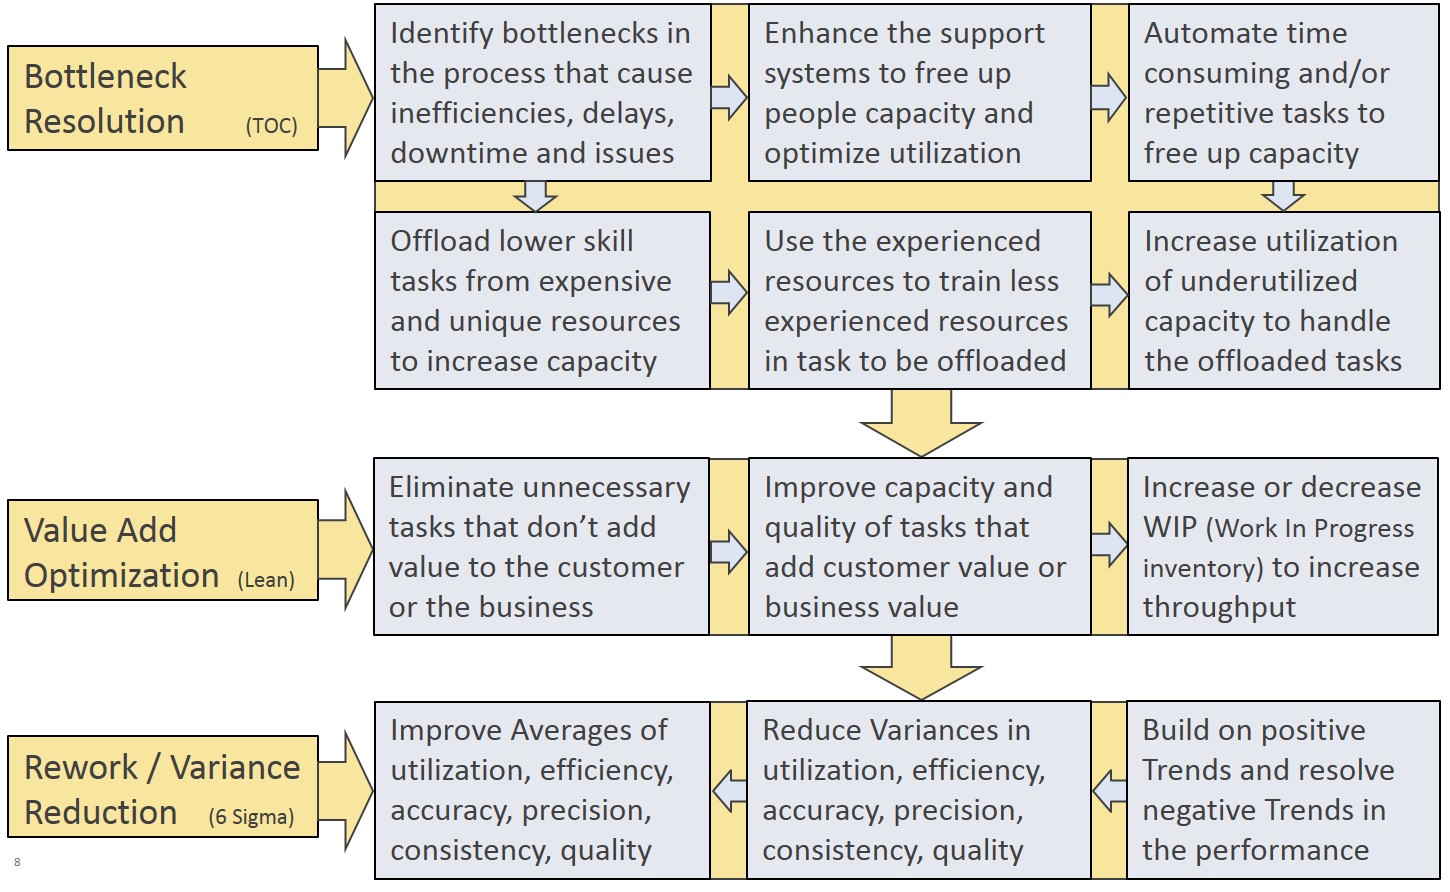
The graphic below highlights a range of alternative options to improve a process. These options are explained in more detail and exemplified in the next three sections.
Bottleneck Resolution Options
Bottleneck resolution deals with increasing throughput by improving the utilization and efficiency of the people and systems involved. After the bottlenecks that cause waiting, delays, idle time, and other throughput reducing issues have been identified, start the sequence of resolving the biggest bottlenecks. Use the following options for this purpose:
- Offload lower skill tasks from expensive or unique resources to increase capacity
If an expensive or unique resource causes a bottleneck, offload some of their activities to an alternative resource that isn't fully utilized. Shift the activities down the capability curve as necessary to resolve the bottleneck, as shown in the graphic below.
For instance, if a doctor is a bottleneck, offload some cases down to a Nurse Practitioner (NP) who can handle these cases.
It can also help to offload up rather than down. This may feel counterintuitive, but can be quite sensible. For instance, if a nurse with a unique skill has too much work, and an NP has idle time, offloading tasks from the nurse to the NP might solve the issue.

- Use the experienced resources to train less experienced resources in tasks to be offloaded
To make offloading work, the experienced or unique resource may need to train the alternate resource. For instance, the doctor can train the NP. Initially this increases the workload, but this temporary issue tends to pay off in the long run.

- Increase utilization of underutilized capacity to handle the offloaded tasks
The idea behind the previous two options is to offload tasks to underutilized resources, so that the workload becomes more balanced. However, the best alternate resource may not have time to handle more work. In this case, offloading tasks through multiple experience levels can be a solution.
For instance, assume the doctor is overloaded but the NP has no free capacity. In this case, the NP may first have to offload tasks down to a nurse who has excess time available.

These first three options move job responsibilities around to stimulate productivity, but potentially also enable career growth for employees. When reassigning work make sure to select employees who can be trained to execute the work. It is counterproductive to put employees in spots they can't possibly handle. Putting square pegs in round holes will lower the productivity.
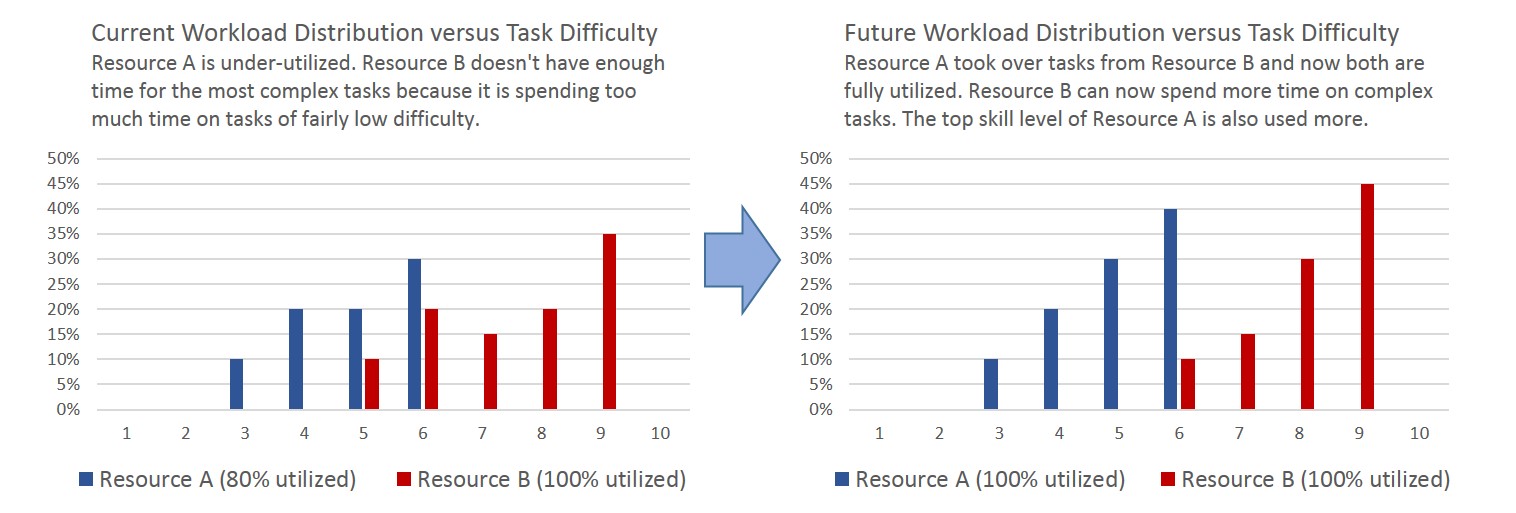
Note that these three options also apply to machine and computer resources. Some devices or systems may have more capabilities than others. Reassigning how and when these are being used can free up capacity of the extra capabilities if those cause a bottleneck. For instance, one diagnostic device could have special features that another device doesn't.
- Enhance the support systems to free up people capacity and optimize utilization
If a machine or computer system is difficult to use, lacks capability, or has insufficient capacity, this can consume the time of the people who use the system. If this contributes to bottlenecks, consider making an investment to enhance the system with new and/or easier-to-use functionality to free up time.
For instance, if an EHR is hard to use or requires too many steps, an upgrade or add-on technology might alleviate the issue.
For example, if an old MRI or CT Scan system takes too long, could it be upgraded? If an EKG or ultrasound system doesn't provide enough capacity, can adding another system resolve the issue?

- Automate time consuming and/or repetitive tasks to free up people capacity
Automating parts of a manual process with technology can be especially effective for tasks that are repetitive, time consuming, and error prone. Systems can often handle such tasks more effectively. The idea here is not to replace people, but to elevate what they do, so they have more time for tasks that require human expertise and interactions.
For instance, if a daily report is created manually, replace it with an automated report or dashboard that can be easily analyzed.

Value Add Optimization
For optimal efficiency at the lowest possible cost, the activities in a process should either add:
- value the customer is willing to pay for (e.g. clinical treatments), or
- value to the business (e.g. legally required accounting activities)
Use the following options to eliminate superfluous activities that don't add value, and to optimize activities that do add value:
- Eliminate unnecessary tasks that don't add value to the customer or the business
Activities that neither add customer nor business value should be eliminated. This frees up capacity, which can then be used to resolve bottlenecks.
For instance, if not having sufficient medical devices causes the staff to spend a lot of time moving the devices from room to room, adding some devices can eliminate the time wasted on moving things around, which is an activity that doesn't add value to making patients better.
For example, consider process ABC again. Assume the person who executes activity B uses 50% of the time to address tasks that don't add value, such as attending irrelevant weekly meetings. By eliminating these superfluous tasks, the person can handle more patients per hour, which reduces the bottleneck of activity B.

For instance, assume activity B includes a daily report that is only used on a weekly basis. Reducing the report frequency to how often the report is actually used will free up time, which can be used to increase the throughput of activity B.

- Improve capacity and quality of tasks that add customer value or business value
It is important to optimize the activities that do add value, so the available time is effectively used to create quality outputs. If an activity isn't well organized, frequently duplicates efforts, produces low quality, creates excess quantities, or results in other value reducing issues, then the activity should be restructured.
For instance, if activity B involves ordering materials and supplies and this activity doesn't make use of common purchasing best practices, then improving this task could improve the throughput of activity B.
- Decrease WIP (Work In Progress inventory) to increase throughput
WIP refers to partially completed results that flow through the process towards completion. In process ABC, WIP consists of partially cured patients. Creating WIP beyond the process capacity doesn't add value, as this WIP can never flow to completion. The time spent on creating WIP would be better spent on offloading activities that cause bottlenecks.
For instance, the person that executes activity A, could spend part of his/her time on activity B. That reduces capacity for activity A, but increases capacity for activity B. It also reduces the WIP that activity A can produce.

- Increase WIP (Work In Progress inventory) to increase throughput
Conversely, a temporary increase in WIP may actually increase the throughput. It can compensate for down time where a resource is temporarily unavailable. It can also offset variations in how long a subsequent activity takes.
For instance, assume the person who executes activity A now also works activity B. That only helps if the person produces temporary WIP while working on activity A that gets processed during the time he/she works on activity B.

Rework Reduction
Low quality and variations in quality tend to result in rework, e.g. to ensure that all outputs fall within the required specifications or expectations. Rework reduction is about eliminating the causes of quality issues. Reducing rework will free up time that can be used to resolve bottlenecks, as time not spent on rework can be spent elsewhere.
Rework that is identified during Process Mapping is easier to resolve than rework that happens behind the scenes and isn't mentioned during mapping. For instance, if a lab technician frequently fails to draw blood in the first pass, this might not be apparent beyond the patients who experience frequent needling.
Use the following option to resolve rework that has been explicitly identified:
- Reduce rework by improving the quality of work
If rework happens a lot, then reduce the rework by identifying and resolving the related quality issues that cause the rework.
For instance, the team might indicate that incoming Summary of Care (SoC) documents for referrals may be incomplete and how that would be handled. The solution could be to improve the information exchange process with the referring provider.
For example, if a patient isn't fully diagnosed correctly, then surgery might not completely resolve what is wrong with the patient, and follow up surgery might be needed. If the follow up surgery could have been avoided, then this is unnecessary rework.
For instance, if a diagnostic device is not calibrated properly or intermittently fails to produce the right result, this could cause misdiagnosis or other quality problems. A recalibration and maintenance schedule could be instated to overcome such issues.

Variance Reduction
Inconsistencies in the process can cause variations (variances) in all four aspects of productivity, i.e. utilization, efficiency, quality and cost. While the average productivity may look solid, the variances can add up to significant issues over time. While increasing the average productivity, you also need to reduce these variances.
For instance, if the utilization and efficiency fluctuates, this can result in transitory bottlenecks that temporarily lower the throughput. Use the following option to reduce the variances:
- Reduce variances by improving the consistency of work
If inconsistencies are substantial, then determine and resolve the causes of the inconsistencies. The bottleneck resolutions options can also be applied to address inconsistency issues.
For instance, if some of the work is too complex for a resource to handle, provide training or reassign the work. If two parallel resources execute the same work differently, use Process Mapping to align how they operate. If a temporary heavy workload causes a decrease in consistency, redistribute the workload.
For example, if two lab technicians execute lab tests in different ways, as shown below, then aligning how they execute the tests can reduce the variances in their test results (their outputs).

When to start using Productivity Metrics
As stated before, the main value of BRM comes from the discussions between the team members. These discussions will align the perceptions, help identify issues and opportunities, and facilitate defining resolutions. Typically you can reasonably complete the above steps without metrics, based on the qualitative impressions and anecdotal evidence identified in the discussions.
However, as the improvements progress, it can become important to have some Productivity Metrics to quantify the impact of the issues and opportunities identified. For instance, to measure the impact of a bottleneck, or the frequency of rework. Having suitable Productivity Metrics can facilitate selecting the most pragmatic and effective resolutions.
Learn more about metrics in the "Productivity Metrics" tab.
Step 3: Process Map - Illustration Part 3
Let's get back to our process map illustration shown at the end of Step 2. Assume that the workload is unevenly distributed, and that it is clear that the NP is overloaded (bottleneck) and the Nurse has time to handle extra work (opportunity).
Given the issues and opportunities identified, the team could improve the process and workload distribution as follows:
- Eliminate the reconciliation report, since nobody is using it.
- Reassign the discharges and sending the C-CDAs from the NP to the Nurse.
- Reassign instructing the patients from the NP to the Nurse.
The first change will free up even more Nurse time since it eliminates a non-value-add activity. The last two changes will free up NP time for triage and treating patients, so these changes will at least partially resolve the bottlenecks those activities caused. These improvements are illustrated below.
Now let's assume that the NP still doesn't have enough time to complete her tasks, but that the Doctor actually has excess capacity. This probably means that the NP is assigning too many patients to him/herself.
This may be due to the criteria defined for assigning who treats what patient. The potential solution is then to change the assignment criteria, so that more patients are seen by the Doctor. This is an example of reassigning up rather than down the experience curve.
Metrics
One can use qualitative impressions and anecdotal evidence to identify bottlenecks, non-value-add activities, and rework. In fact, during Process Mapping participants will typically voice that bottlenecks, wasteful activities, and rework happen. This qualitative data can be sufficient to make reasonable improvements, but may not be sufficient to refine the improvements.
A more advanced approach is to use Productivity Metrics that measure the various aspects that drive productivity. Such metrics can support the decisions how to improve the process, and the verification that the improvements are working. For this purpose, the metrics must provide quantifiable measures of performance and progress.
Productivity Metrics can be used to measure aspects that drive utilization, efficiency, quality, and cost. The best metrics are Specific, Measurable, Achievable, Relevant, and Time-bound (SMART) as explained in the table below. The definition of SMART varies in literature, but common aspects are that SMART Metrics support the objectives, can be measured and trended, and can be used to act.
| Criteria | Description | |
|---|---|---|
|
Specific |
Targets a specific and well-defined aspect that supports the objectives |
|
|
Measurable |
Quantifiably measures the current status and future progress |
|
| Achievable/Actionable |
Focuses on an aspect that is achievable, and yields data that can be acted upon |
|
| Relevant/Realistic |
Measures a relevant aspect that can realistically be improved |
|
| Time-bound/Timely | Is measured on an interval basis during a defined period of time | |
Averages, Variances, and Trends
In a metrics-supported process improvement strategy, there are three parameters to consider for each metric: average, variance, and trend. These parameters deal with process variations in throughput, quality, and cost. This works as follows:
- Averages
Averages indicate the typical result. Averages can indicate that on a general basis things are well or problematic.
For instance, if the employee utilization on average is 95%, that seems good. On the other hand, a 60% utilization would be problematic as it indicates a lot of unused resource capacity, which is costly.
- Variances
Averages can hide or overstate problems as there may be pockets of problems that average out. Variance indicates how much and how often results deviate from the average. The higher the variance, the more this indicates that pockets of problems exist.
For instance, with an average utilization of 95%, some employees may work overtime while others have down time. If overtime means extra pay, this makes the process more expensive. The variance in the utilization of the various employees can confirm that this is going on. If the variance is high, the indicates an opportunity to redistribute work to balance the workload.
- Trends
Trends are patterns that indicate whether things are improving or getting worse. Averages and variances are a snapshot in time, and can hide or overstate performance issues. Trend analysis tracks how the averages and variances change over time, and can be used to prioritize the resolution of issues.
For instance, if overtime pay is increasing, this indicates a more urgent and growing problem than when overtime pay is stable.
For example, if the trend is that the NPs are getting increasingly overloaded, while the nurses have more and more idle time, this means that the NPs are a bottleneck that can potentially be resolved by offloading work to the nurses. This trend would confirm the workload distribution assumption made in the first paragraph of illustration part 3 in the "Process Improvement" tab.
Utilization and Efficiency Metrics
Utilization and efficiency metrics provide a quantitative means to evaluate the size of the bottlenecks and to determine what resolution options can result in a significant improvement. Use these metrics to enhance the bottleneck resolutions:
- Increase the average utilization and efficiency

If the averages are low, use the bottleneck resolution options to increase the efficient utilization of the resources.
- Decrease variances in utilization and efficiency

If the variance from the averages is high, use the bottleneck resolution options to reduce these fluctuations.
- Reverse negative trends in utilization and efficiency and build on positive trends
If the averages are going down and the variances are going up, use the bottleneck resolution options to reverse this trend.
Quality Metrics 
Quality metrics offer a quantitative means to evaluate quality issues and to determine how rework and variance reduction could result in a significant improvement. Use these metrics to enhance the resolution of low quality or variations in quality:
- Increase the accuracy

If the accuracy is low, increase the average quality by resolving the causes of low quality.
- Increase the precision

If the precision is low, decrease the variance in quality by making the process more consistent.
- Reverse negative trends in quality and build on positive trends
If the accuracy and precision are going down, adapt the process to reverse this trend.
Cost Metrics 
Cost metrics offer a quantitative means to evaluate whether the current process is cost effective, and to determine how Process Improvement could affect the cost. Use these metrics to resolve cost issues:
- Decrease the average cost

If the cost per unit of output is high, reduce the cost by improving the utilization, efficiency, and quality while taking cost into account.
- Decrease the variance in cost

If the variance is high, decrease the variance by resolving the utilization, efficiency and quality causes of these variations.
- Reverse negative trends in cost and build on positive trends
If the cost average is going down and the variance is going up, use the bottleneck resolution options to reverse this trend.
BRM deals with cost improvement mostly from the perspective that if you increase the throughput and quality without adding new resources that the relative cost per unit of output will go down. However, if pervasive cost issues exist, then a more substantial financial analysis should be deployed. This analysis goes beyond the scope of this toolkit.
Detail Level Productivity Metrics
To enable Process Improvement, it may be necessary to measure more detailed metrics at the activity and process level. The table below lists metrics that can be relevant to improve the four productivity drivers. The arrows indicate whether to improve them up or down.
| Productivity Metrics | |||
|---|---|---|---|
| Driver | Metric | Description | Improve |
|
Utilization
|
Utilization |
% of Time spent working |  |
|
Idle time |
% of Time spent not working |  |
|
| Wait time | % of Time spent waiting for something to finish |  |
|
| Overtime | % of Paid Time spent beyond regular hours |  |
|
|
Efficiency
|
Throughput | Number of output units produced per time period |  |
| Cycle time | Time it takes to produce one unit of output |  |
|
| Overhead time | % of Time spent on required overhead tasks |  |
|
| Non-value-add time | % of Time spent on activities that add no value |  |
|
|
Quality
|
Accuracy | Average quality that is produced compared to the output specifications |  |
| Precision | Degree of variation (variance) in output quality (regardless of accuracy) |  |
|
| Rework frequency | Frequency of how often the rework happens |  |
|
| Rework time | % of Time spent on rework |  |
|
|
Cost
|
Cost of Goods (CoGs) | Cost of materials incorporated into the outputs |  |
| Activity Cost | Expense of time spent on activities plus cost of consumables and supplies |  |
|
| Overhead Cost | Cost of the time spent on required overhead activities |  |
|
| Contribution Margin | Sell price minus cost of one output (Indicates whether the cost is high) |  |
|
Key Performance Indicators (KPIs)
Organizations often measure many metrics, but this can become overwhelming to employees, which is counterproductive. Using many metrics simultaneously for decision making is not practical. It might even obscure what actually results in real improvements. It is also unlikely that many metrics will be immediately relevant to the Process Improvement objectives.
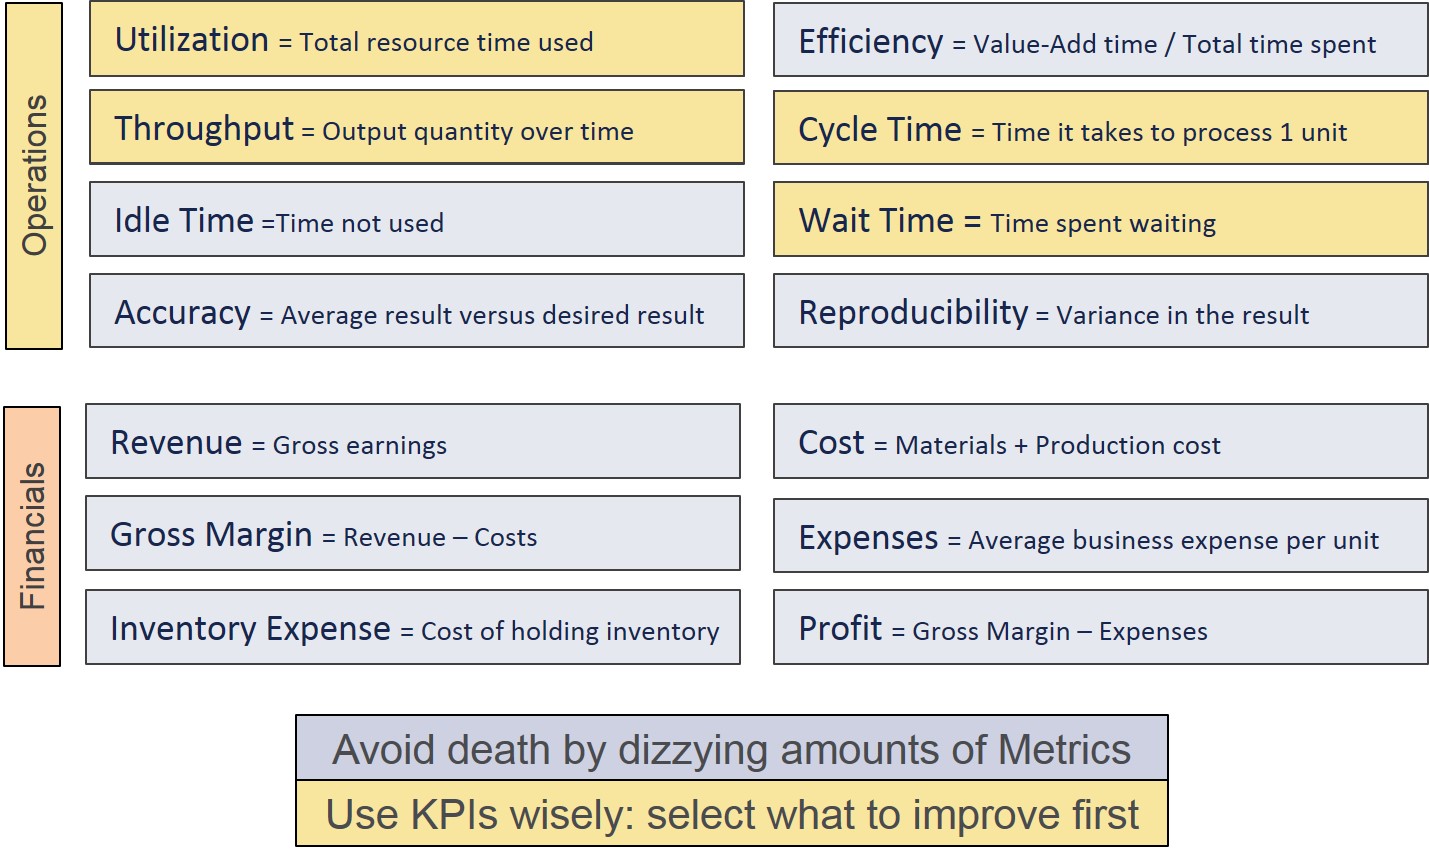
The graphic on the right shows metrics that may be useful for Process Improvement. That is a lot of metrics to deal with, and additional metrics might be needed to measure process performance against business objectives. For instance, clinical metrics to measure the quality of the clinical outcomes.
To solve the overload issue, it is good practice to focus on a few metrics first as Key Performance Indicators (KPIs), and to add or replace KPIs as the improvements progress.
KPIs are context driven metrics that specifically measure success and alignment with the most important objectives. A good number is to focus on three or five KPIs.
The metrics highlighted in yellow are often good KPIs to start with. The other metrics can move in and out of the picture, as the Process Improvement progresses.
As BRM incrementally improves the process in bottleneck resolution cycles, it suitably supports limiting the number of KPIs that are in play at any time. For each subsequent cycle, different KPIs can be selected and prior KPIs can move into the background depending on the current objectives.
One will likely not know up front which metrics will be used as KPIs, and historic data will be needed for future KPIs to be meaningful. It is therefore still useful to measure additional metrics well before they become KPIs. Just don't present them all to the team each day, as they will likely stop paying attention to any of it.
Using Metrics to support Decisions and Actions
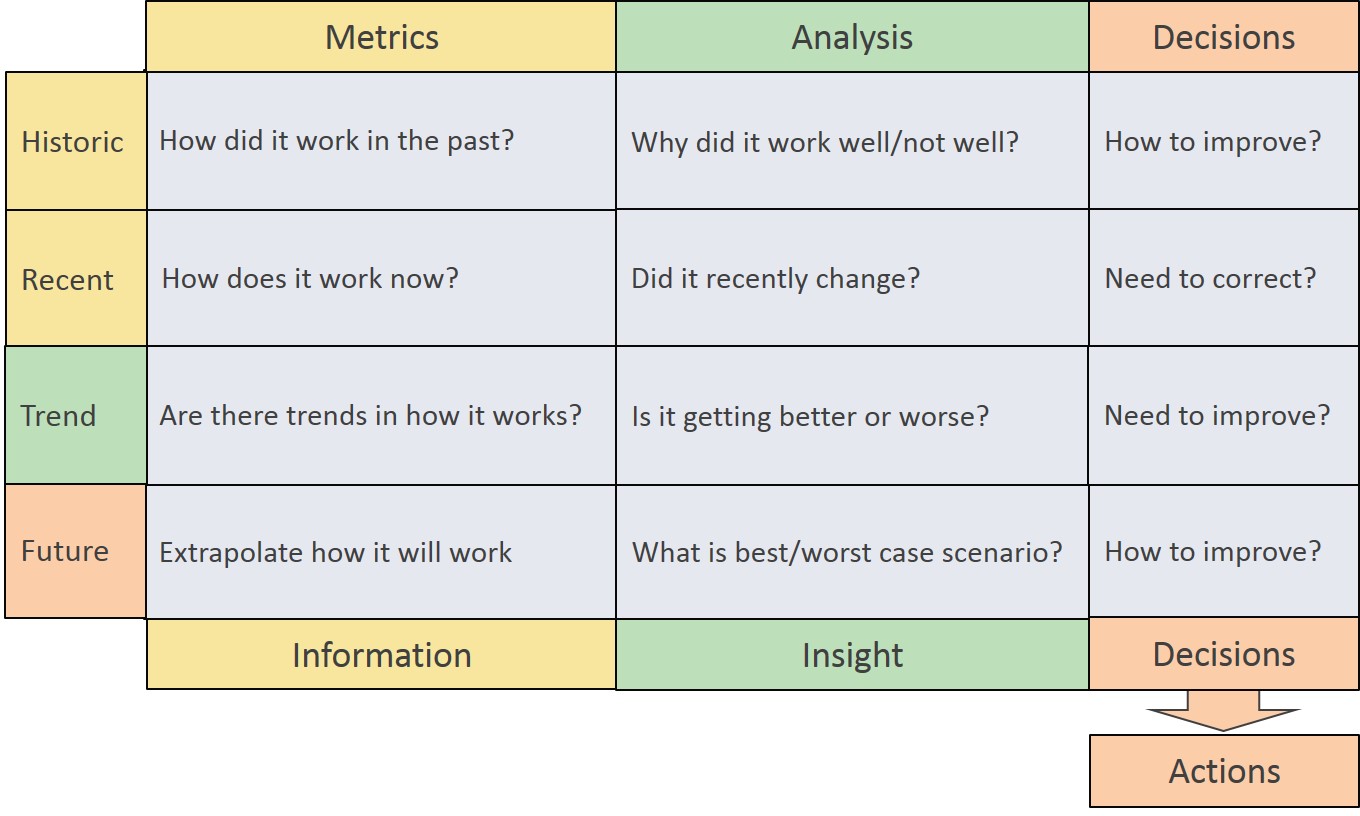
Consider the Productivity Metrics again. There is a dimension in the timeline that reflects that processes change over time, and that there are long and short term changes. Metrics can be used to measure the historic and recent process performance, and this information can be extrapolated to forecast the future performance. This time distinction can enable better improvement decisions.
The graphic below shows how each part of the metrics timeline can assist in the decision making. For instance, a metric might indicate that historically there has been an issue that should be resolved through Process Improvement. A metric might also indicate that something started to happen recently and that this simply needs to be corrected.
Forecasting is not an exact science and should not be done as a single prediction, as predictions rarely come to full fruition. That will invariably make you either fail or far exceed expectations. Neither will look good to management as it makes it look like you don't know what you are doing.
When making predictions, develop best and worst case scenarios to forecast the future as a range. As things progress, keep measuring the metrics and monitor the reality versus the predictions to study the effects of the implemented improvements. Adapt the process again if things don't work as anticipated.
Graphical Dashboards
When you measure a metric over time this tends to create a lot of data, especially as the measurement frequency increases. For instance, measuring once per day produces 365 data points per year, but measuring once per hour, yields 8,760 data points per year.
It is typical for the raw data points to be tabulated along the time axis, for instance in Excel or a metrics tool. While this is a great way to track the raw data, analyzing data tables to study averages, variances, and trends can quickly become overwhelming and is inefficient for most people.
A far more practical approach is to create dashboards that graphically represent the data. Especially when it comes to analyzing trends, a picture can truly tell a thousand words. For instance, the average, variance and trend graphs for the selected KPIs could be included in a KPI dashboard. This will provide a quick view on the performance measured by the KPIs.
Advanced Metrics Topics
The topics below go into more sophisticated detail in how to use and interpret Productivity Metrics. These aspects can be important for more advanced Process Improvement.
Statistical Variations
The example graphs of the averages, variances and trends displayed above show nice smooth patterns over time. It is rare that measured data actually looks so evenly distributed.
Besides the process variations that can be controlled, processes are prone to statistical variations that cannot be controlled. These variations cause the data points to fluctuate up and down at a much higher frequency than what is shown in the graphs.
For instance, the number of patients seen each day will vary; patients have different ailments and may require more or less time; the need for resources like medical devices and staff will vary depending on the patient; staff knowledge and efficiency will depend on the case; staff might call in sick, et cetera. These things just happen and the process has to deal with it.
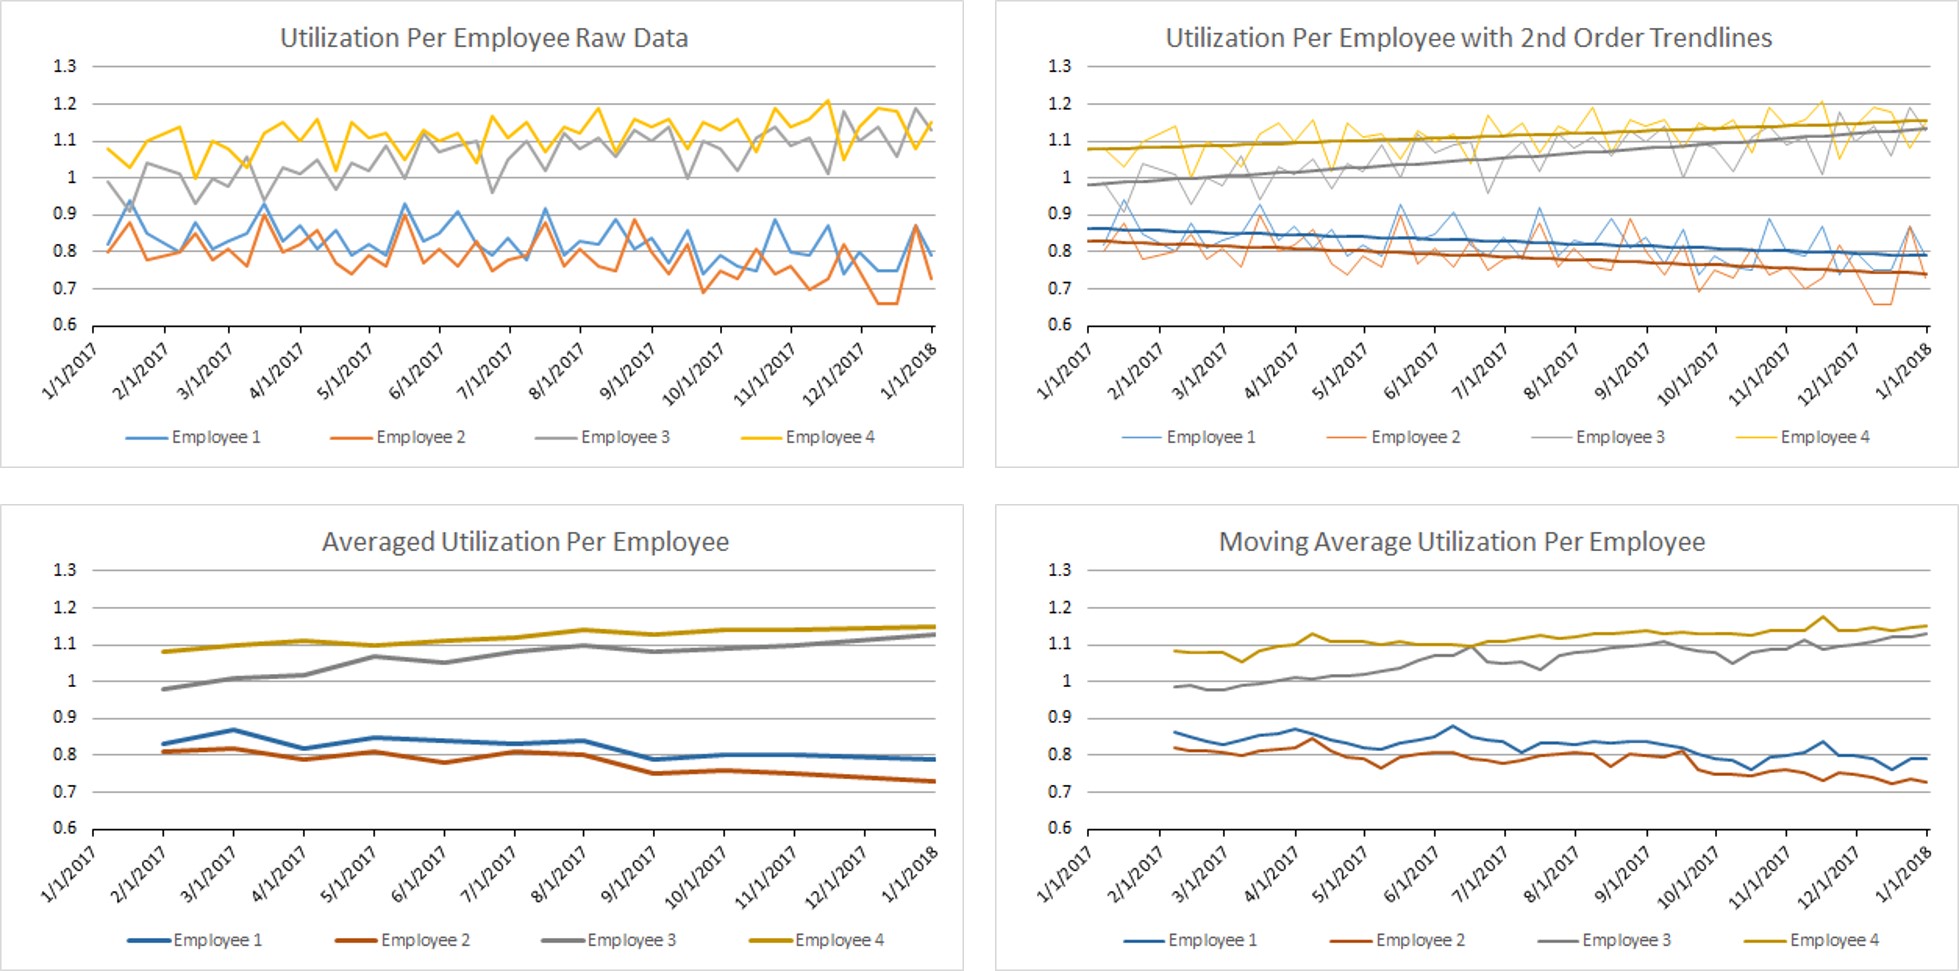
Statistical variations will cause the process average and variance to fluctuate, and will obscure the trends. Look for instance at the top left graph below, which includes such statistical variations.
Trend Analysis versus Statistical Variations
There are several ways to bring out the trend information hidden in data with statistical variations. Which method yields the most valuable results may depend on what is being measured versus the level of detail needed to draw proper conclusions. The following trend analysis methods are commonly used:
- Fit a straight line or 2nd order polynomial to the data to add a trend line. See the top right graph above. Trend lines do not convert the data, but merely show a potential pattern in the data. The downside of this method is that it hides shorter-term variances caused by the process.
- Average the data across time periods. For instance, average weekly data into 4 week data: average weeks 1 to 4, average weeks 5 to 8, and so forth. See the bottom left graph above. Averaging reduces the number of data points and the statistical variation. This method can still show short-term process related variances depending on the chosen averaging period.
- Convert the data into moving averages. This means averaging the data over a time period that moves along the timeline. For instance, average weekly data into a 4 week period, and move this period on a weekly basis: average weeks 1 to 4, average weeks 2 to 5, average week 3 to 6, and so forth. See the bottom right graph above. While this method only reduces the number of data points slightly, the reduction in statistical variation can be considerable. This method will still show short-term related process variances, provided the chosen period isn't too long.
Limiting the Impact of Statistical Variations
While the causes of statistical variations cannot be controlled, that doesn't mean the impact can't be decreased. In fact, understanding the statistical variations can be important for Process Improvement. To improve how a process deals with statistical variations, first identify the causes of the variations, and then look for opportunities to decrease the impact.
For instance, how many patients request a doctor's visit will vary from day to day. Now consider two different scenarios for dealing with the varying volume of requests. The second scheduling scenario would be a good method to limit the impact of the statistical variation in the requests:
- An assistant immediately schedules a visit every time a patient calls, and accommodates most of the patients' requested dates. In this case, the call statistics will ripple into the scheduling with limited consideration of how busy the staff is. As a result, the daily workload may vary greatly.
- Another assistant receives the requests via a patient portal, and balances the schedule to spread out the visits. The assistant uses the portal to ask patients if they are ok with alternate dates if the requested dates interfere with creating a balanced schedule. In this case, the call statistics will not ripple into the scheduling as much.
Statistics versus Measurement Frequency
The measurement frequency is an important factor that influences whether statistics can be observed. The frequency is inversely proportional to the time period between each measurement. A higher frequency will typically provide a more detailed view on the statistics. What can be observed will depend on how the measurements are made:
- If a metric is measured as a snapshot in time, each data point will be similarly affected by the statistics. Increasing the time period between each measurement simply lowers the measurement frequency. This will worsen the ability to deal with the statistics, as there will be less data points.
- If a metric measures everything that happens during a time period, each data point will be less affected by the statistics. Using a longer time period has a similar effect to averaging the data, as the measurement adds up the variations during the time period. This can hide much of the statistical variations, which may actually make trend analysis easier.
Seasonal and Temporary Effects
Metrics data may also be affected by seasonal and temporary effects. This means that the process data could vary depending on the time of year, or due to short term events.
For instance, in the summer, patients may avoid scheduling their annual checkups, but visits might spike in a hot summer or snowy winter due to accidents. Holidays could result in more patients with gastronomical or stress related problems, and daylight savings time might cause a rise in acute arterial issues.
Seasonal and temporary fluctuations will overlay the data, which can hinder process trend analysis. For instance, using trend lines will not work as well. Especially, straight trend lines may become biased as these can't account for these fluctuations.
Using averaging and moving averages may yield better results as these methods can preserve the seasonal and temporary fluctuations, provided the chosen averaging time period isn't too long and the measurement frequency is high enough.
Limiting the Impact of Seasonal and Temporary Effects
To enable effective Process Improvement, one must distinguish seasonal and temporary effects from other process trends. These effects cause peaks in workload, which may cause temporary bottlenecks. The approach to eliminate these bottlenecks will likely have to be different than for permanent bottlenecks.
For instance, don't fix a temporary bottleneck by defining the maximum capacity as the capacity needed during high season. That would mean that the process has excess capacity the rest of the year. It will be wiser to address temporary bottlenecks with temporary or flexible capacity:
- Temporary capacity are resources that are available on a temporary basis, such as consultants, staff-on-call, or temporarily rented medical devices. The downside can be the repeated need to train such staff, e.g. if the same staff isn't available each time.
- Flexible capacity are permanent resources that can be assigned to different tasks at different times. For instance, during high season one could assign certain staff members to the peak activity by postponing other tasks that can wait. This avoids the training issue.
Facilitator
To enable a positive experience, it is good practice to have a facilitator to guide the Process Mapping and Improvement sessions. A facilitator can teach the team how mapping works, facilitate the mapping sessions, and enable the improvement discussions.
Process Mapping enables discussion amongst the process team, and it documents the process. What the team discovers and accomplishes in the discussions tends to be far more valuable than the process map that gets created.
It is important that the facilitator assumes a neutral perspective to not unduly influence the discussions. Don't overly focus on the map, and don't drive what the map should look like. Good facilitators observe, ask questions, learn, get discussions unstuck, make suggestions, enable building on what already works well, and avoid prescribing what the process should look like.
It can be good to start with a Process Mapping consultant in this role. However, once the team gains experience in BRM, a team member with good personal skills can typically become the facilitator. Managers can facilitate too, but they need to exercise restraint, as being a manager interferes with being perceived as a facilitator.
The sections below discuss tools and methods facilitators can use to enable Process Mapping and Improvement sessions.
Use Facilitative Questions
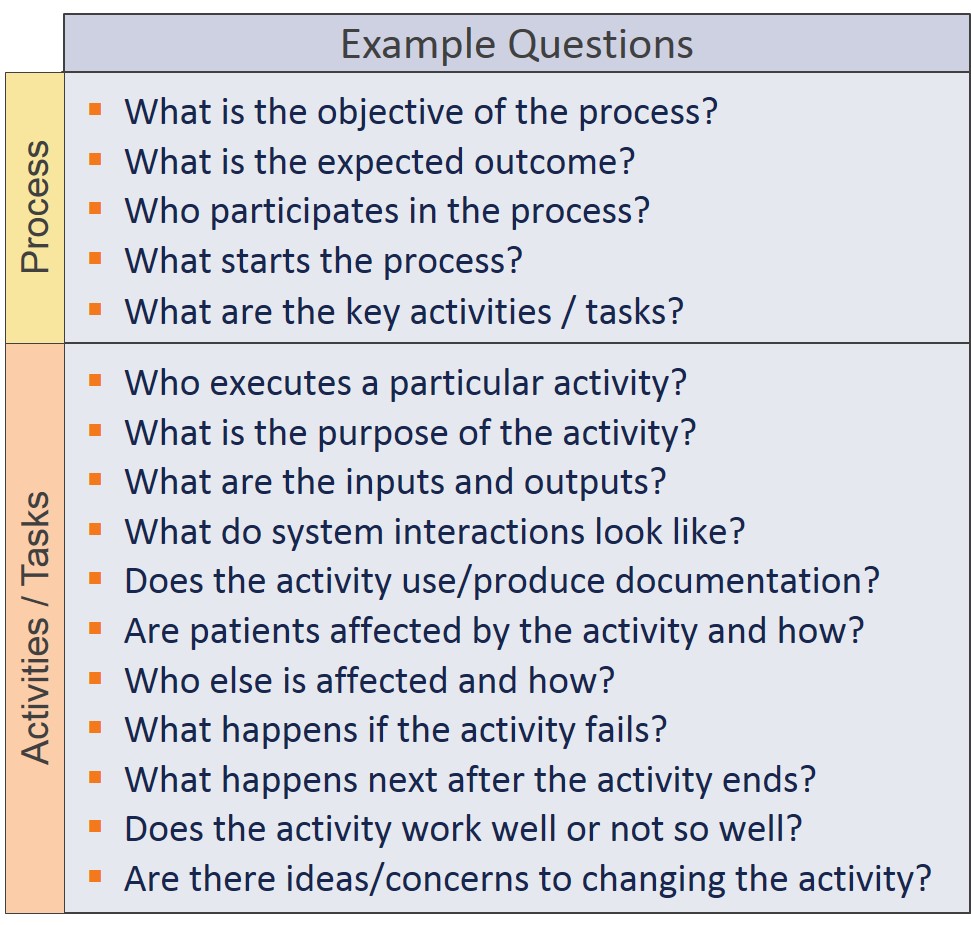 The facilitator needs to keep the Process Mapping and Improvement discussions going. Here are some techniques to do this:
- Ask lots of "what, when, where, who, and how" questions to stimulate the participant interactions.
- Avoid rhetorical or "why" questions*, because these can feel presumptuous, accusatory, or even parental, and tend to shut people down.
- Instead of "why", ask questions like "what is the purpose", or "what needs to be accomplished", which gets closer to the core of why things are important.
Good facilitator questions cover the process and the activities. Process questions gain information on the entire process, while activity questions focus on obtaining information on the process activities. Example questions are shown in the table to the right.
Questions are not only a good way to find out what happens in the process when all goes well, but also to uncover what happens when an activity fails to produce what is expected. This aspect helps in identifying potential areas of improvement.
* Some Process Improvement methods suggest to use "why" questions to develop an understanding of why things happen. The same can be accomplished without using "why",
to take into account that from a coaching perspective the tone of "why" can quickly put people on the defensive, which is counterproductive in uncovering what you need to know.
Create Facilitator's Parking Lot
During Process Mapping, the participants will express varying viewpoints, which can lead to heated discussions. Participants may also dive into defining improvements prematurely. When things get heated, or improvement discussions take over, redirect the discussion:
- Acknowledge that an issue is not yet resolved, or that an idea is not yet incorporated. Acknowledgement ensures that participants can let go and move on.
- Create a parking lot on a large sheet of paper on the wall to write down such issues and ideas. This ensures participants know it won't be forgotten.
- Use sticky dots to mark in the map where the issue or idea occurred.
Assemble Process Mapping Tools
Prepare for facilitating a Process Mapping session by assembling the following tools ahead of time:
- Process Mapping canvas (white board, or large easel paper sheets taped to the wall)
- Rectangular or square sticky notes to represent the activities and tasks
- Square sticky notes for questions and decisions (tilt these notes by 45 degrees to make them look like a diamond)
- Colored markers to write down the activity and decision statements and draw arrows
- Colored dots to highlight issues and opportunities
- Parking lot canvas (part of the white board, or a large sheet of easel paper)
Use Prototyping and Pilots
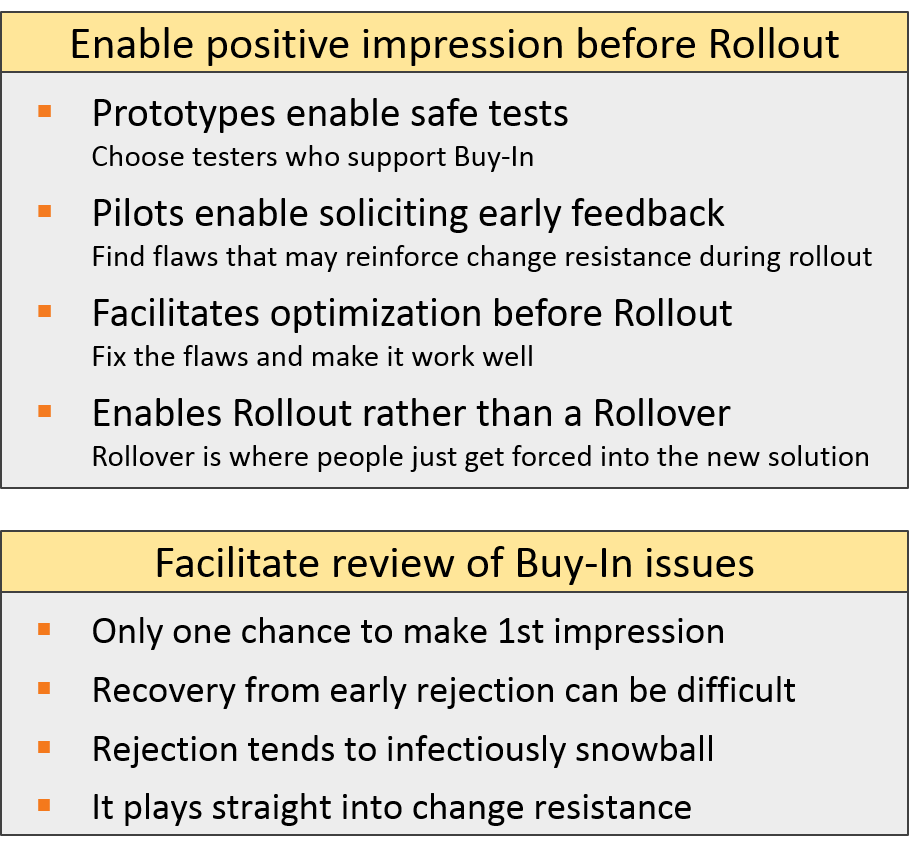 In Process Improvement, the "you only get one chance to make a first impression" principle applies, but yet it can be difficult to fully predict how the improvements will pan out.
Avoid that resistance and rejection builds before it can be proven that the improvements work. When improvements fail, recovery from an early rejection can be difficult to overcome. Rejection plays into resistance, and tends to snowball across employees.
Incrementally rolling out the improvements tends to work better than big all-encompassing rollouts. Accepting change can be hard for most people, and an incremental approach makes it easier for people to understand and adapt to change.
BRM is an ideal method to define improvements incrementally, as it resolves bottlenecks in cycles, but that doesn't stop you from rolling out all the changes in one go. To roll out the improvements incrementally, stimulate the team to use prototyping and pilots:
- Define a set of improvements with BRM, prototype the new process, and pilot the prototype process with a smaller open-minded group to test the waters and enable constructive feedback.
- Based on the feedback, adapt the improvements to work properly before rolling them out.
- Then repeat this sequence to define, prototype, pilot, and roll-out the next set of improvements. Each roll-out should have an updated process map to reflect how the process will work going forward.
Enlist Managerial Support
Managers can help the facilitator to keep the team focused and on track. Enlist the manager who owns the process and ask them to:
- Set the stage by presenting a vision for Process Improvement. He/she can also set boundaries for the process to be mapped.
- Keep an open mind when they notice that the process deviates from their expectations.
- Participate but avoid explicitly expressing how they think the process should work, as this will stifle the openness of the team and hinder the effectiveness of Process Mapping.
- Stimulate the discussion, avoid assigning blame for deviations, enable the incorporation of knowledge and experience, and encourage trial and error. If a manager behaves to the contrary, this can quickly grind progress down to a halt.
If a manager acts as the facilitator, it is important for the manager to keep these facilitative aspects into mind, because being the manager inherently conflicts with being seen as a facilitator.
Recruit Champions
Recruiting the assistance of champions is another good way to enable success. Champions are employees who have a sound understanding of the process and have facilitative personality skills. Enlist champions and ask them to:
- Participate in the Process Mapping to define the current process and the Process Improvement. However, don't limit participation to the champions, as Process Mapping is most effective when all or most team members are involved.
- Act as change agents to help explain changes to others, and promote the value in order to create buy-in and overcome resistance.
- Help deploy the improvements, train others, and enable adaptations to the changes to make them work.
Avoid a Cost Cutting Perception
Avoid the perception that Process Improvement is about cost cutting as that will kill morale, undermine open participation, and likely won't improve the process very much at all. Instead, set the stage that Process Improvement is focused on business and personal growth.
For instance, ask management to clarify that the objective of productivity improvement is to free up resource capacity that can be invested in growing the business and its employees. This will enable team motivation to participate and will focus their suggested improvements on increasing business revenue, profitability, and impact.
That isn't to say that cost cutting may not be necessary, but that shouldn't be the main objective of Process Improvement as that won't work. Nevertheless, Process Improvement can be a great tool to recover from randomly imposed cost cuts. It will require extra effort though to overcome suspicion and to get the team to realize that this is the case.
Protocol Analysis
Facilitators should learn about the process ahead of time, so they can understand and guide the discussions. To prepare, they can use Protocol Analysis to create a mental model of the process. Protocol Analysis consists of exploring the documentation, conducting management and staff interviews, and observing the staff in action to gather and analyze information about the process.
Creating a mental model will yield a great starting point to enable the Process Mapping and Improvement sessions. It will provide information that will aid the facilitator to keep the sessions on track, elicit discussions that reveal how things work, and suggest improvement opportunities when the team gets stuck.
Step A: Collect Process Information
To collect information for creating a mental model of the process, execute the following three steps:
Exploration: Study what management thinks happens
Review the process documentation and training materials to explore how the process was intended to work, to understand the recorded objectives and terminology, and to evaluate whether this documentation was maintained. Use what you learn to assemble questions for the process owner.
Then interview the process owner to get his/her perspective, the current objectives, and how he/she thinks the process should work. Record what you hear.
Staff Interviews: Study what the staff thinks happens
Based on what you have learned so far, assemble questions for the staff and select staff that works across all parts of the process. These questions will be similar to the Facilitator Questions discussed above.
Then interview the staff to obtain their perspective on what they think they do, or should do. Also ask them where, when, and how they handoff the process to other staff members. Record what you hear. It is likely that what the staff tells you will differ from what management told you. The staff will probably also give you varying perspectives.
Staff Observations: Study what may really happen
Based on what you have learned, choose real life cases or assemble scenarios for simulated cases that exemplify the process. Then task the staff with executing these cases and observe while they execute the process.
Ask the staff to think aloud when they execute their activities, so you can follow what they think. Discuss the expected and unexpected activities with them, but don't interrupt the process. Record what you hear and observe.
It is likely that what you observe will differ from what the staff told you during the interviews, as observations are more likely to elicit their real expertise.

Step B: Form the Mental Model
To create the mental model, identify, study, and analyze the information obtained as shown in the graphic below. Only go as deep as you need to feel comfortable that you have sufficient understanding so you can confidently act as an effective facilitator. You can also create a preliminary process map if this is helpful for your understanding.
Step C: Use the Mental Model to define a Facilitator Strategy
Use the mental model to define a strategy for how to best facilitate the Process Mapping and Improvement sessions. Determine who should be involved, enlist the manager and champions, prepare for dealing with the potential group dynamics, define the right questions, et cetera.
Keep in mind that unless a process is highly structured and well documented, Protocol Analysis is unlikely to yield an exact model of the process. This is not an issue if the facilitator stays open minded to adapt his/her mental model as the mapping session progresses. When it turns out that the process doesn't fit your mental model, be flexible and adapt your facilitation effort to what is discovered.
The reasons why the mental model won't match the actual process align with the process life cycle discussion on the "Introduction" tab. These reasons include:
- It is unlikely the manager and staff truly know how the process works.
- The interviews and observations will reveal that the manager sees the process differently than the staff, and that the staff perceptions vary.
- Interviews and observations have pitfalls that yield flawed information, as explained in the next two sections on this tab.
Pitfalls of Interviews
Sharing expertise is hard, and eliciting expertise from others is even harder.
- Interviewees often lack awareness of their own expertise, and the interviewer may not know the right questions to overcome this issue.
- Even if the interviewee is aware, they may struggle to articulate their expertise, and the interviewer may not realize the gaps as they lack the insight.
- The interviewee may worry about job security and be reluctant to share expertise, and the interviewer may get trapped in this reluctance.
As a result, interviewees misstate their expertise, omit relevant aspects, deem relevant aspects trivial, and deem trivial aspects relevant. Due to lack of insight, interviewers may not be able to recognize that these events occur and might have his/her own biases.
Pitfalls of Observations
"Doing" is easier than "Recalling what you do", so observations tend to paint a better picture of the process than interviews. However, have you ever felt pressured and inhibited when people look over your shoulder? The same will likely happen when you observe an expert. The result is that experts will behave differently than when they execute the process unobserved.
When you observe experts in action, this will include process and communication deviations. Process deviations reflect real things the expert is doing differently during observation. Communication deviations are only perceived deviations that result from what the expert says versus actually does. It may not be apparent that these deviations occur.
Negotiation
Process Improvement is context dependent. What can be done depends on the organization, people, resources, and funding. The views on what the best approach is will differ among the stakeholders. As such, Process Improvement has to be negotiated among the process team, and their choices need to be aligned with management, business objectives, and budgets.
This tab describes how to conduct Win-Win negotiations. The content is intended as guidance for Process Improvement facilitators, and for others who want to hone their skills to negotiate what they need to meet their productivity and personal goals.
Negotiation Styles
There are various negotiation styles with different outcomes as to who wins or loses. For Process Improvement, the recommended negotiation style is to conduct WIN-WIN Negotiations, because it enables everyone to get what they need to execute their activities efficiently and with personal satisfaction. This style also results in the most buy-in.
- WIN-WIN Negotiation assumes you can make the pie bigger, so everyone can get a fair share. WIN-WIN is not about getting everything you want, as it requires give and take and compromise. It may not even yield equal shares. It merely ensures that everyone gets at least the minimum they need and can accept. It enables agreements people will live up to.
- WIN-LOSE Negotiation assumes a fixed size pie that needs to be divvied up. It is a zero-sum game where if you get more, someone else gets less. As losers don't really buy-in and accept what they agree to, this style isn't effective in Process Improvement. Winners might feel it is, but will find out later that it wasn't when the improvements end up not working.
- LOSE-LOSE Negotiation obviously isn't anyone's objective. It may result from a WIN-LOSE Negotiation that goes so poorly that the negotiators dig in, and either walk away or reach a meaningless agreement. For instance, this can happen when negotiators need to make decisions while having to guess what other negotiators might decide (prisoner-dilemma).
As WIN-WIN Negotiations are most conducive to establishing effective Process Improvement, the rest of this tab will explain how to negotiate WIN-WIN solutions.
WIN-WIN Negotiation
People have shared and diverging interests. They also have different ideas for how their interests should be met. Negotiators will present their own interests and ideas, and will be the voice for the people they represent. They will agree on some aspects and differ on others.
WIN-WIN Negotiations focus on creating agreements by finding the common ground and resolving the differences. The negotiation consists of four key activities:
- Discover the interests of the negotiators and people they represent
- Discuss first what you can agree on as a base for an agreement
- Invent alternative options for what you cannot yet agree on
- Exchange these options until you reach a negotiated agreement
While the activities are sequential, the negotiators can cycle back and forth through them as necessary to make progress.
The sections below explain the activities with examples based on "New Car", "New Position", and "Process Improvement" negotiations. The examples are intended to illustrate the story, and don't cover all permutations of how such negotiations might be conducted.
Discover the Interests
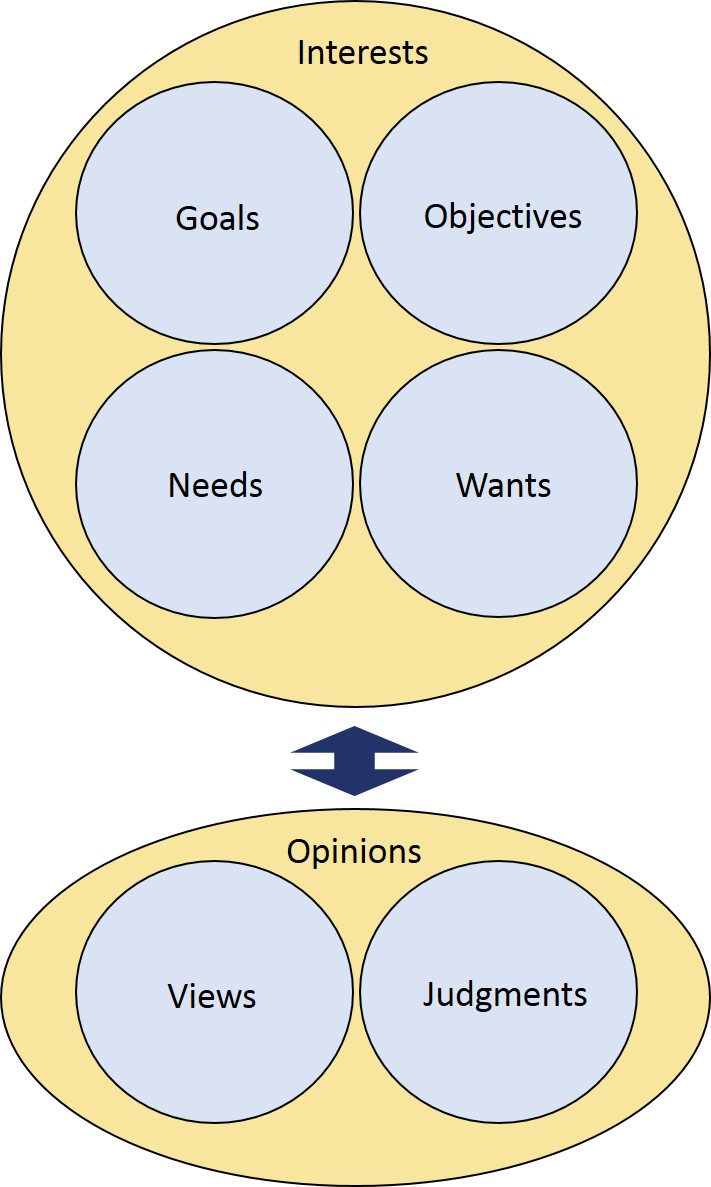 To negotiate effectively, it is essential to first discuss and understand the interests of the other negotiators, including the interests of the people whom they represent and are affected by the negotiation. Interests may be phrased as goals, objectives, needs, and wants.
Once you understand the collective interests, you can more easily accommodate what the various stakeholders prefer. In business settings, you will have to understand both the business and personal interests of the organization, management, employees, and other relevant stakeholders.
Listening and being attentive to the interests of others also helps in building relationships. This is important because when people have rapport, they negotiate more easily. It makes discussions more focused on common ground and less confrontational.
Be aware that people may state opinions. Opinions sound like declarative views and judgments, and may question the ability or motives of others. For instance, how something "must be done", or "can't be done". There typically is a long history of experiences that led to the opinions. As such, negotiation can rarely change opinions, nor should that be the goal, as that can lead to arguments nobody can win.
When an opinion is voiced, dig deeper to understand the underlying interests by asking facilitative questions. Watch your tone to avoid alienating anyone if they feel you are questioning their opinion. For instance, if someone states "Scientists don't want to do paperwork" (Opinion), find out "Why is it important? What stops them? Does it interfere with their priorities? What might help them do it?" (Interests).
To experience the difference between discussing opinions versus interests, review the statements in the table below:
- Opinions on the left are stated as declarations that are difficult to negotiate, and may even sound offensive.
- Statements on the right are framed as series of interests that are more relatable to people involved in a process.
|
Opinions |
Interests (goals, objectives, needs, wants) |
|
|---|---|---|
|
Being directive is an effective management style, because it clearly defines what the staff is supposed to do. |
|
|
|
The staff is set in its ways and doesn't express ideas on how to do things better. |
|
|
| The current workflows work well, it is the best we can do, and it is how we have always done it. |
|
|
| Medication reconciliation will reduce errors. |
|
|
| PhD scientists don't want to do paperwork. They just want to provide their scientific services to our clients, and don't care whether we can bill for it. | To stay in business, we need to be able to invoice for the work our scientists complete for our clients. The paperwork to track the work needs to be simplified so it takes less time away from providing scientific services and so that it doesn't interfere with their other priorities. Their manager needs to allocate time for the paperwork and support it as being a priority. |
|
For instance, consider how the following example negotiations start:
- New Car: A dealer strikes up a friendly conversation to figure out what car and features you like and can afford. In return, you can express what car and models you are interested in, and indicate what features are essential to you. The dealer will do their best to connect and build rapport with you.
- New Position: The employer advertises their position and seeks out and interviews candidates to select the person that offers the highest value, and best fits the team. If you are selected for an interview, you get the opportunity to explain what you can offer, to connect with the interviewers, and to express your own interests for your future.
- Process Improvement: Process Mapping yields a reflection of the process. Productivity Improvement Step 1 and Step 2 reveal issues, and ways to improve the process. However, these BRM activities also provide insight into the interests of the participants. To enable other participants to express their interests, use questions that elicit their goals, objectives, needs, and wants.
Note: In Process Improvement there is risk people perceive being blamed for problems. If you hear "you are the biggest bottleneck" (TOC), "your activities are waste" (Lean), or "your work is deficient" (6 Sigma), how would that make you feel in terms of getting on board? Avoid assigning blame, as it is not constructive. It sounds opinionated and will undermine the relationships and the negotiation.
Note: Recognize when people purposely or inadvertently stonewall negotiations with opinions. For instance, people who prefer to block change or like to negotiate for WIN-LOSE may do this. Your best bet to get them out of this mode is to ask interest-focused questions.
Discuss First What You Can Agree On
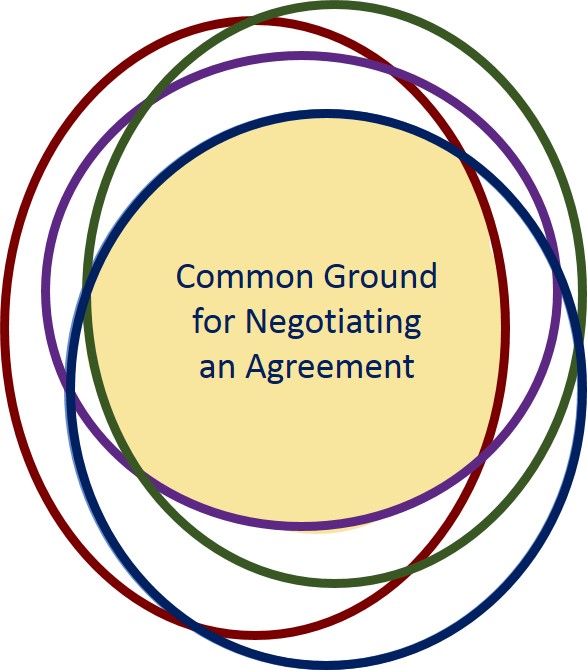 Discuss first with the other negotiators what aspects you agree on, because these aspects don't need negotiation. It is the common ground that can be used as the basis for a negotiated agreement. The more you already agree, the easier the negotiation becomes.
Identifying common ground early helps to build relationships conducive to mutually beneficial negotiation. It makes people more vested in negotiating an agreement, as it will feel like something was already accomplished, which makes it harder to walk away.
For instance, consider how the example negotiations continue:
- New Car: The dealer will demo a loaded version to get you excited, but offer a base model to make the car look affordable. The aim is to get you to a "Yes" on the model and dealership, as that will make you more inclined to buy something.
- New Position: The employer will select a few candidates that offer high value, fit with the team, and seem motivated. They will do follow up interviews to refine their selection. Up to this point the discussions are mostly about what they need versus what you offer, and your fit to the organization. These activities build up to a "Yes" that they want you, and that you want to work there.
- Process Improvement: Productivity Improvement Step 1 and Step 2 provide a way to gauge what the team thinks should be done. As it becomes clear that things don't work as expected, and there are ideas on how to make things better, consensus will build that something should be done. Going to Step 3 before reaching this consensus can make it more difficult to negotiate improvements.
Invent Alternative Options
The next step is to invent alternative options to address aspects you cannot yet agree on. Think of this as growing the pie based on understanding the collective interests. Inventing options moves a negotiation from making "Yes/No" choices to "Option" choices.
- "Yes/No" choices aren't a negotiation, because some will win, while others will lose depending on what side of the "Yes/No" equation they are on. This may lead to "take it or leave it" discussions that aren't effective in creating a solution.
- "Option" choices on the other hand provide a range of ways to solve one or more aspects to be resolved. Options are conducive to negotiated compromise, modification, expansion, and trading.
Inventing options requires preparation prior to negotiation, but options can also be invented during negotiation, especially if both sides aim for WIN-WIN. You can use the Ideation and Opportunity Analysis method explained at the end of this tab for this purpose.
For instance, consider the example negotiations again:
- New Car: Dealers will offer you option packages to show that you can buy a configuration you like and can afford. The packages are designed so they can negotiate an attractive configuration at the highest price you are willing to pay. They aim to make the negotiation not be about whether you will buy a car, but about how much of a car you will buy and at what price.
- New Position: The employer may state that they appreciate what you bring, restate their objectives, express a career path, explain the benefits, and offer a salary. They will have a salary range, but the initial offer will be based on your perceived skills, knowledge, experience, and fit. You can proactively offer options for what else you could do for them to expand the pie in the negotiation.
- Process Improvement: The options provided for Productivity Improvement Step 3 are suggestions for how to improve a process through WIN-WIN Negotiation. Adapt the options to your process to accommodate the interests of the stakeholders. Explore what, where, when, who, and how to refine the options to make them work. Also develop additional options as suitable for your process.
Exchange the Options
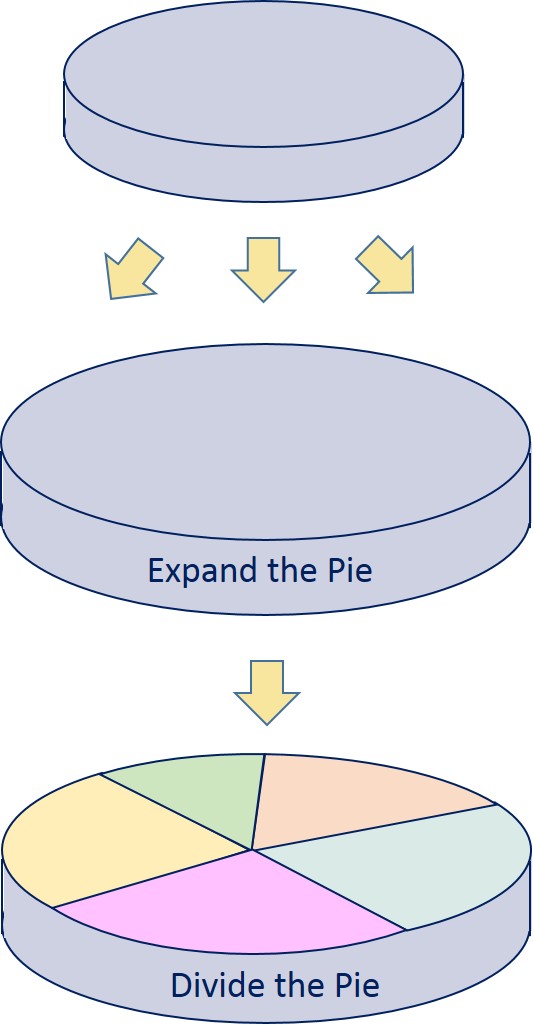 The final step is to negotiate how to address the aspects where the interests diverge. Use the invented options to negotiate an agreement in two ways:
- Expand, modify, break up, and combine the options to become mutually agreeable: "Maybe not this way, but what if we did it slightly differently". If this leads to agreement, these options morph into becoming part of the common ground. This is about expanding the pie. Be flexible and creative and make this the core of the negotiation. The better you do this, the more you will get your interests met.
Use this as an opportunity to make your case that what you propose has a mutual advantage. If you can enlighten others that what you ask for is also in their interest, you might be able to persuade them to accept your preferred options as their own. Adapt what you propose to make that work. Vice versa, also look for ways to make their preferred options acceptable to you.
- Trade the options so everyone wins and loses some aspects. This means that each negotiator will give up some of their less important options in exchange for acceptance of their preferred options: "If you do this, I will accept that." This is about dividing the pie. Consider this to be the last resort, because you will be giving up parts of what you want. The shares of how much each negotiator will give up will likely not be equal.
Don't give up on interests that are a priority to you, as that could make you feel like you lost. On the flip side, don't make everything a priority, because that will stop you from making smart trades. Chose your priorities wisely.
For instance, in the example negotiations:
- New Car: Option packages can be combined, and dealers can add options, such as a roof rack, tow hitch, or fog lights. You can select the car color, trim, and other visuals. Your preferred combination will have a list price, which you can negotiate down by trading the options and haggling the price, until you reach a configuration you want at a price you are willing to pay.
- New Position: Initial offers typically leave room for a higher salary, but don't just ask for more money. You can persuade them you bring more than they realized. You can offer to expand your role in exchange for raising your salary. You can ask for additional perks, like flex hours, time to work remotely, extra days off, an office, or a delayed start to take that planned vacation first.
- Process Improvement: Expand, modify, break up, and combine the invented improvement options until you agree on as many aspects as reasonable. Resolve remaining aspects by trading additional options, i.e. jointly select combinations that the negotiators can agree to. Continue this negotiation to define an improvement agreement the stakeholders can buy into.
Tips for WIN-WIN Negotiation
The sections below offer tips based on generalized perspectives that can strengthen your WIN-WIN Negotiation position. Adapt how you communicate these perspectives to your own style. Don't take the section headers too literally, as these are meant as reminders that may help you when you feel pressured in a negotiation. One exception: "Be Patient", as that is essential to winning your fair share.
Be Patient
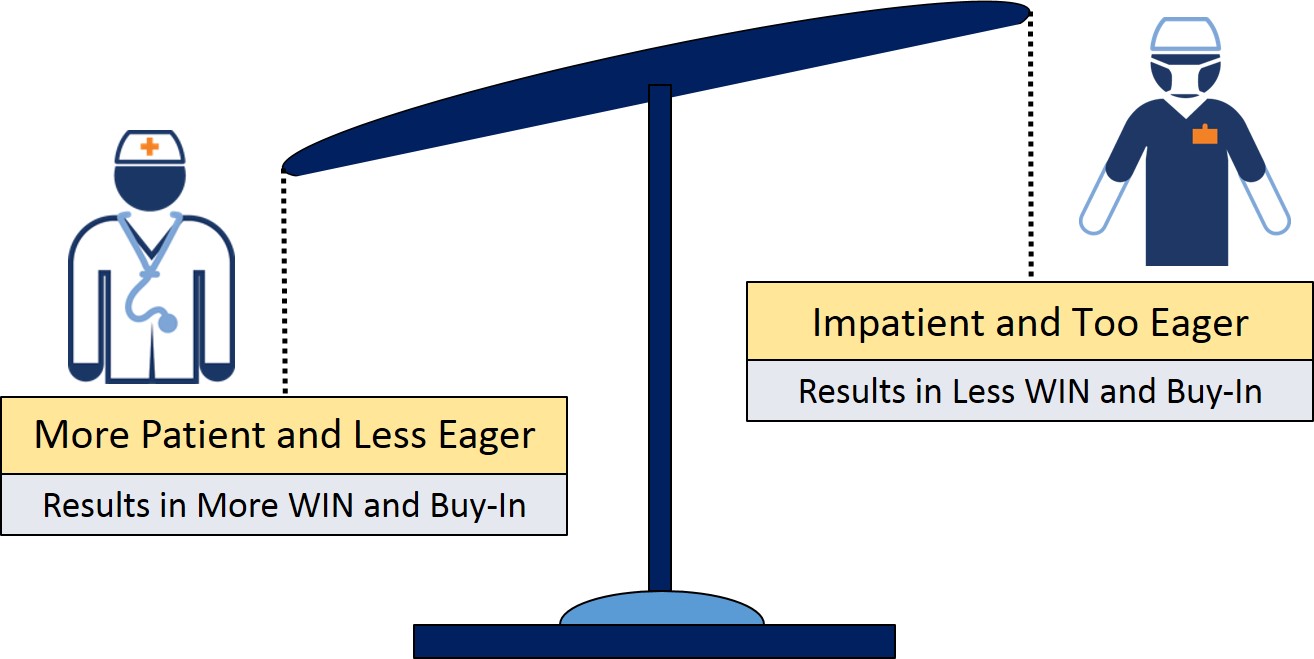 The main driver for maximizing what you get is to maintain your patience. If you look overly eager to reach an agreement quickly, you will get less and pay more. The other negotiators still want their needs met and will become more insistent on what they want.
Impatience and eagerness to make a deal expand the pie less and shifts the fairness curve towards the others. In particular, take your time to adapt the options until they meet your needs before insisting on getting to an agreement.
For instance, if you lose your patience or become too eager when negotiating:
- New Car: You will get less car and pay more.
- New Position: The offer will increase less, resulting in smaller salary and fewer additional perks.
- Process Improvement: The improvements will favor the work of others, and there will be less buy-in for what you want.
Assume Everything Comes at a Price
The premise here is that if you want to negotiate something of value, you most likely need to give something of value in return. Price in this context isn't just money:
- The reason why option negotiations work is because options typically have a perceived value. So while negotiating, think of what you can exchange for what you want. What makes your proposal attractive to the other side?
- There are soft relationship currencies you can use to negotiate, such as building goodwill, showing support, providing assistance, giving recognition, promoting others, granting favors, calling in favors, et cetera. Soft currencies work better if the negotiators have a reciprocal relationship, as this will make the negotiation less about "deliverables for money".
For instance, this is why relationship sales tend to result in better solutions for buyers at higher prices for sellers. If a buyer feels a seller has their interest in mind while offering solutions with options that solve their problem, the buyer is less likely to focus on getting the lowest price. Vice versa, if a seller doesn't feel squeezed, they can afford to provide a great solution. A WIN-WIN for both.
Note that this tip is not equivalent to stating that "everyone has a price". For successful WIN-WIN Negotiation that isn't a commendable strategy, as buying people to do the wrong thing isn't in their interest.
Never Agree to Split the Difference
In negotiations, never agree to a "let's split the difference" offer, because there is no basis for splitting differences. If you agree, you likely leave money or other things of value on the table, because the other side just told you they are willing to still go down (or up). The difference is arbitrary and depends on when the statement is made. As such, there is a good chance they are willing to go down further.
So what do you do when the other party offers to "let's split the difference"? Make another counter offer, and make it known you aren't ready to settle on the difference.
For instance, in the example negotiations:
- New Car: The sales person may go talk to the manager to ask for approval for a better deal. Chances are they come back with "let's split the difference". Make a counter offer, especially if you think splitting still isn't a good price.
- New Position: Your future employer may offer to go up half way between their last offer and the salary you are asking for. Make another reasonable counter offer if you are not happy with this new offer.
- Process Improvement: Managers may say that what the team proposes isn't covered in the budget. This is a "fixed price" and "split the difference" type of answer. The goal of a company is to make money and/or have impact. If you can deliver that, they can typically offer funds beyond the budget. So your counter offer will need to somehow realistically increase profit and/or impact.
The right counter offer may not be to offer more or less money, because WIN-WIN Negotiations are never just about money. Read the situation. If it feels like they might be getting close to walking away over the money, ask for a few more options instead. What the other negotiators can grant will depend on the flexibility of their organization, so be reasonable and strategic.
For instance, when negotiating:
- New Car: Ask for additional freebies or services. These don't cost them nearly as much as what you might have to pay if you purchased them.
- New Position: Ask for additional perks, such as flexible hours, time to work from home, extra days off, an office, or a delayed start so you can take that vacation first.
- Process Improvement: If the budget is indeed rigid, find ways to scale back the Process Improvement, even if this means that it will be less impactful. Be pragmatic and don't propose the ideal solution. Make clear what the decrease in impact is, so it doesn't catch them off-guard later. For instance, if the improvement increases profit, how much less will the profit increase?
In these examples, your counter offer may prompt the person to go back to their management before they can agree. If they do, you will likely get more. If you don't get more, you can still accept what they offered so far. At this point, they invested considerable time, so they aren't all that likely to walk away. However, they probably realize that neither are you.
Build the Relationship
 Negotiations simply go smoother when the negotiators perceive they have a meaningful and trusting relationship with an abundance of common ground. They will become more likely to use soft currencies, instead of insisting on equal value for value. For instance, they may grant favors or provide help in exchange for the potential of return favors and help in the future.
Come well prepared so you can make your case and explain your proposals. Speak in terms of your interests, and refrain from stating opinions. You can and should be persistently persuasive, in particular when things move away from what you need and want. However, do so politely and be careful that it doesn't amount to opinionated bullying to enforce your will, as that will break trust and the relationship. Remember, everything comes at a price. You might win the battle, but lose the war.
The relationship is most important when you frequently negotiate with the same negotiators. For instance, in Process Improvement you will have to negotiate with the same people repeatedly, and having sound professional relationships is essential to continued progress. In a car purchase on the other hand you negotiate with the seller only once, so if you step on their toes that won't have a long term effect.
In contrast, in WIN-LOSE Negotiations the relationship will suffer as the losing side will feel that they are one-sidedly being squeezed. Frustration will grow that the winning side only has their own interests in mind and isn't being reasonable. This will undermine the relationship, and the willingness to use soft currencies will go out the window.
Note: In incidental negotiations it can be useful to take the gas off your friendliness when a relationship feels fake. When facing that uneasy feeling of friendly pressure-sales tactics, it could be best to scale back reciprocating the pleasantries. For instance, in used car, timeshare, home improvement, 2 for 1, and other pressure sales... slow it down. Being patiently reserved can help avoid the impulse buy.
Don't Negotiate the Non-Negotiable
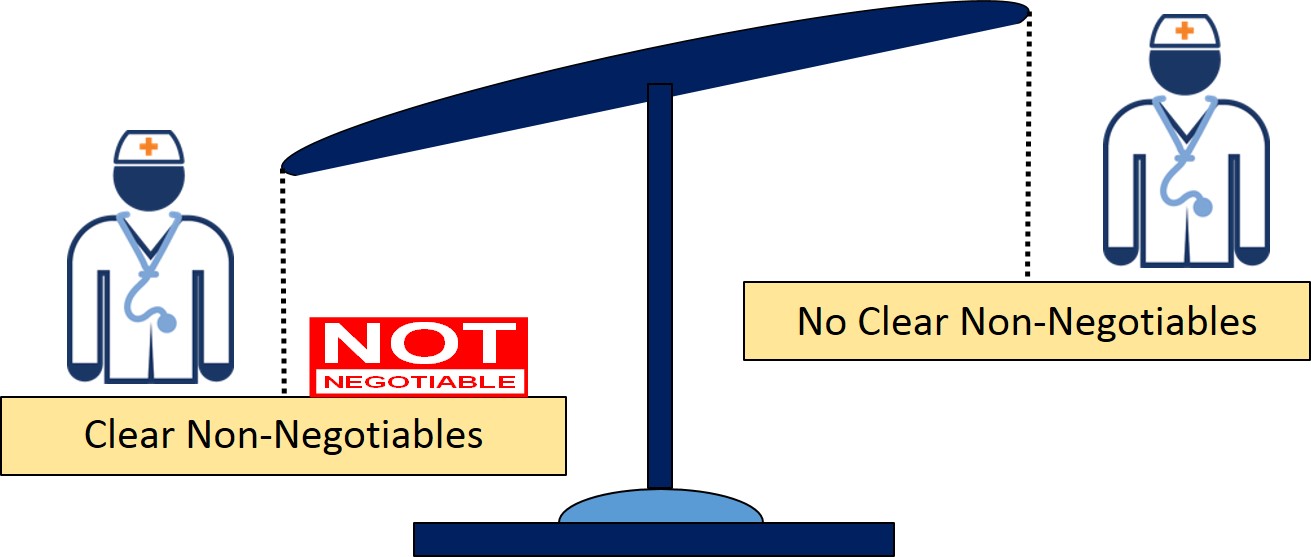 It can be useful to make it clear that something is non-negotiable, because you consider it a must have, principle, value, requirement, or other reason that makes it off limits. Non-negotiables are interests that you believe must be met. Negotiating the non-negotiables can create confusion, break trust, and distract from getting to an agreement.
Likewise, your fellow negotiators may have their own non-negotiables that you have to deal with. If a party doesn't make clear what their limit is, this could leave them vulnerable to negotiating this limit away, or it may lead to an inadvertent perception that they are simply obstructing progress.
For instance, when negotiating:
- New Car: The option packages typically can't be altered. These are prescribed by the factory to optimize their production schedule to keep the price down versus what they anticipate people will buy.
- New Position: The standard benefits typically can't be negotiated. At best you can select from some options available within those benefits, such as an individual versus a family health plan.
- Process Improvement: Whether improvement must happen needs to be non-negotiable. This avoids that change resisters start to negotiate the necessity of improvement, and keeps the negotiation focused on how the process will be improved. The scope and boundaries may also have to be defined as non-negotiable to avoid that the improvements become a moving target.
Assume Everything is Negotiable
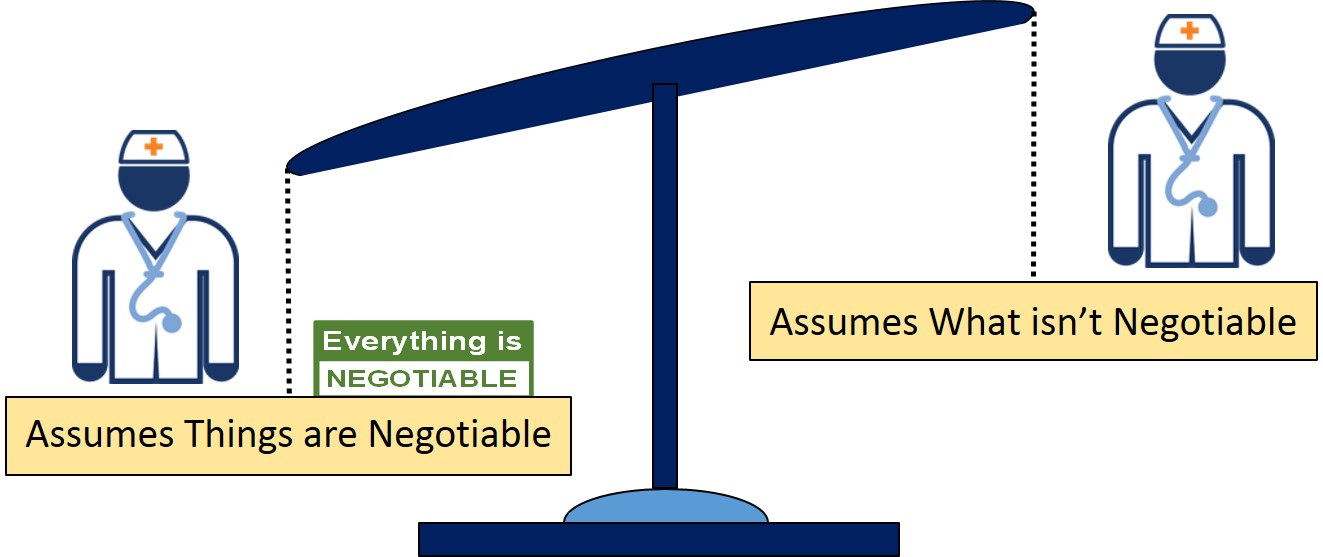 In principle, reasonably assume everything is negotiable unless it is clear that something isn't. In other words, don't assume the other side considers an aspect non-negotiable. Assumptions about what is non-negotiable will undermine your negotiation position. Most things are in fact negotiable.
The question is "what price makes it attractive", and as explained above, price is not just about money. Analyze the interests of the other negotiators to figure out what you can provide or give up in order to get concessions from them.
In this sense, the order of negotiation matters. When something is expressed to be non-negotiable, focus on the negotiables first. Without harping and stepping on toes, keep an eye out whether non-negotiables turn out to be negotiable anyway. This can happen when other aspects have been settled and this changed the circumstances as to why something was non-negotiable.
Walk Away for Best Alternative to a Negotiated Agreement
Know when to walk away. Before going into a negotiation define the minimum you need to reach before it is not worth making an agreement. Walking away can trigger other negotiators to make concessions, especially if they haven't reached their minimum yet.
If your minimum is a moving target, you might get a smaller piece than you might like. It may lead to making too many concessions, and ending up with an agreement where you feel you lost. Once you agree, backtracking can be difficult and will undermine trust.
Know your Best Alternative To a Negotiated Agreement (BATNA). How can you address your needs if agreement doesn't happen? Without an alternative, your minimum might go down during negotiation, as it may leave you hesitant to walk.
Knowing when to walk requires homework. Use the internet, and talk to friends, family, or colleagues to find out what else is out there and what others were able to negotiate. Balance the cost of holding out versus how much more you might be able to get.
For instance, when negotiating:
- New Car: Know what the minimum configuration is you want and the maximum price you are willing to pay. Your alternative may be to go to another dealer, if they could give you a better deal. Research other dealers before you start to negotiate.
- New Position: Know what you want to get out of a new career and the lowest salary you find acceptable. If you have other offers, you have alternatives. If you don't, the alternative is to keep looking for a better position and higher salary elsewhere.
- Process Improvement: Walking away from improvement negotiations is not advisable. Management and colleagues won't take it kindly if you refuse to further participate. Unless you are willing to leave the company, you probably won't walk away, like you might in a car negotiation.
The answer is to not take walking too literally. Instead, know when to politely say "no", when aspects go too far, or not far enough. The best alternative may be to offer a different way to resolve these aspects by being flexible with your own interests.
Example: You can say "no" if the implementation will take longer than expected, or be more expensive than the budget.
In this case, offer alternatives that do fit the timeline and budget.
Example: If what is proposed is more than you can handle, you can admit that you aren't ready for the responsibility.
In this case, offer to take training so you can get there, or negotiate for someone else to take it on.
Others cannot walk either, which balances out the dilemma. As such, listen carefully to their "no"s, and consider whether you can be more flexible. Don't dig into opposition mode, as in essence that is equivalent to walking.
Adapt to Unbalanced WIN-WIN Negotiations
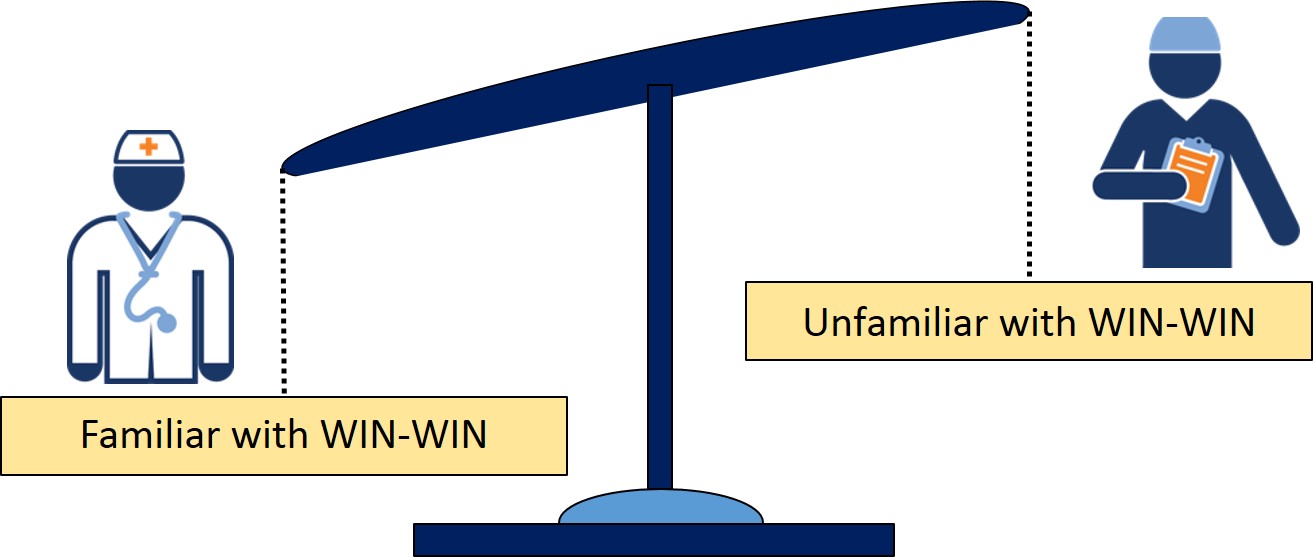 Ideally WIN-WIN Negotiations are balanced where all negotiators are familiar with this type of negotiation. It helps if the negotiators are proficient in understanding other viewpoints, can contribute to inventing options, are good at making sensible choices, can accept compromise, and know they need to take the cost into account.
However, what if fellow negotiators don't know how to conduct a WIN-WIN Negotiation, aren't proficient at it, or can't contribute to all aspects? It still works, if you can constructively enable the negotiation. Focus on understanding everyone's interests, and facilitate others to do so too. Invent options, even if you are the only one doing so, but allow others to contribute. Also facilitate the option exchange.
For instance, a new car sale is an example of an unbalanced WIN-WIN Negotiation that works:
- Only the dealer invents the options, and their option packages are not even open to modification. The only option you can offer is a trade-in. This puts you at a disadvantage. Except, you can insist on options that they can throw in as "freebies", like a roof rack, a tow hitch, floor mats, and other incidentals.
- Only you hold the purse, which gives you an advantage too, especially if you don't mind haggling. List prices have high margins, so you can negotiate the price down. You can walk away and go to another dealer. Make sure to know when to walk to strengthen your position. Except, if you go too far, they may tell you "no" and end the negotiation.
Dealers may continuously seek confirmation whether you are getting closer to a Yes: "If we do this, will you buy?" This pressure won't feel like WIN-WIN, but the result is. If you buy a car with the options you want at an acceptable price, you will feel you won. They won too, as they sold a car. Dealers make sure buyers don't think they lost, as that leads to buyer's remorse and cancellation.
So the WIN-WIN approach still largely works because new car sales people are trained negotiators who facilitate you through the process. Nevertheless, when buyers are more proficient in WIN-WIN Negotiation, they can win a larger share of the pie: "a nicer car at a much lower price". In other words, being the one who understands WIN-WIN Negotiation gives you an advantage.
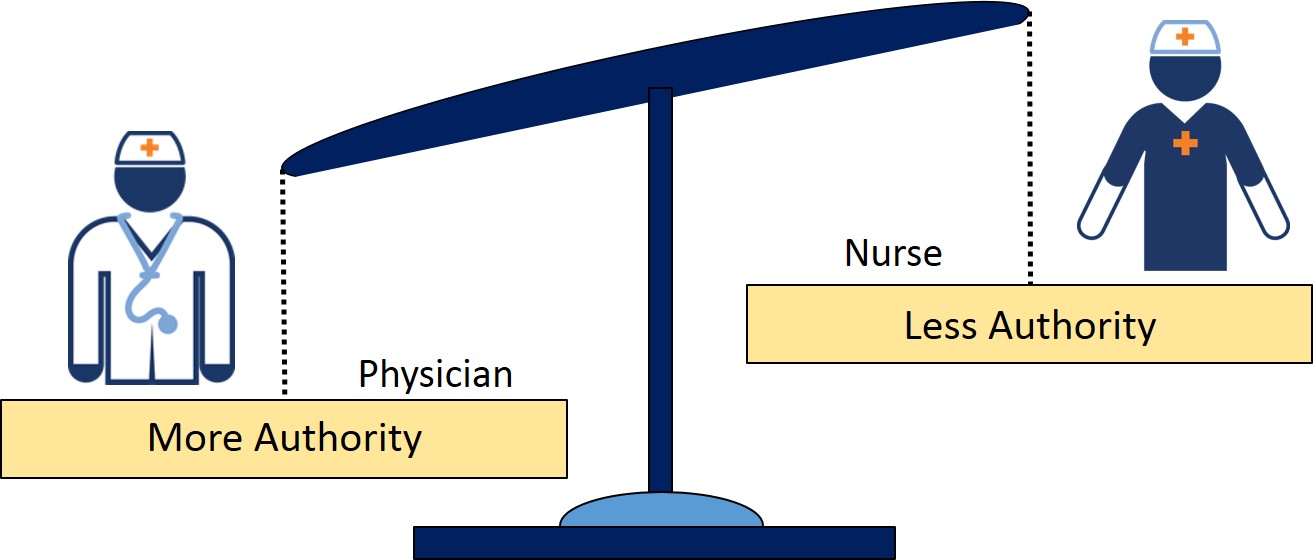 Negotiating with people of authority creates another unbalanced situation because their position of power gives them an advantage. They can enforce their will on the people that report to them, or are dependent on them. Nevertheless, WIN-WIN Negotiation will still work best for the subordinate, as it minimizes that they become the loser simply because of the power differential.
For instance, your managers can make one-sided decisions about your role and they hold your paycheck. However, they also need performance from you, so they have an interest in keeping you motivated. So while they have a power advantage, you still have plenty of leverage to negotiate for WIN-WIN.
Ideation and Opportunity Analysis
An important component of Process Improvement is to identify options for how the process can be improved, and in particular how the interests of the various stakeholders can be addressed.
People have all sorts of ideas how things could be done, and they can get quite attached to their own ideas. This can make it difficult to make progress when the ideas vary widely and passions run high. Ideation and opportunity analysis is a structured way to overcome these issues. This two step method can help in generating and selecting ideas that will work. The two steps are described below.
Organize an Ideation Session
An ideation session is basically a team activity in which you brainstorm ideas. The ideas can be written on sticky notes that are placed on a board. For instance, in Process Improvement you would brainstorm ideas for how to improve the process.
During this session, consider all ideas as reasonable ideas, as it doesn't matter at this stage. Refrain from questioning, criticizing, or valuing the ideas as that will stifle the brainstorming. This is important, because labeling ideas as "bad ideas" may quickly turn people off from generating more ideas.
At the end of the session, group the ideas by common themes. For instance, for Process Improvement you can group them by the part of the process they intend to improve, the issues they might resolve, and/or the method proposed.
Organize an Opportunity Analysis Session
An opportunity is an idea that is suitable and viable. This means that the idea is valuable and affordable, fits the people involved, can be implemented, and will produce a desired impact. Not all ideas are opportunities. For instance in business, ideas may not fit the team or organization, can be impractical or too expensive, or might fall outside the business scope, goal, or objectives.
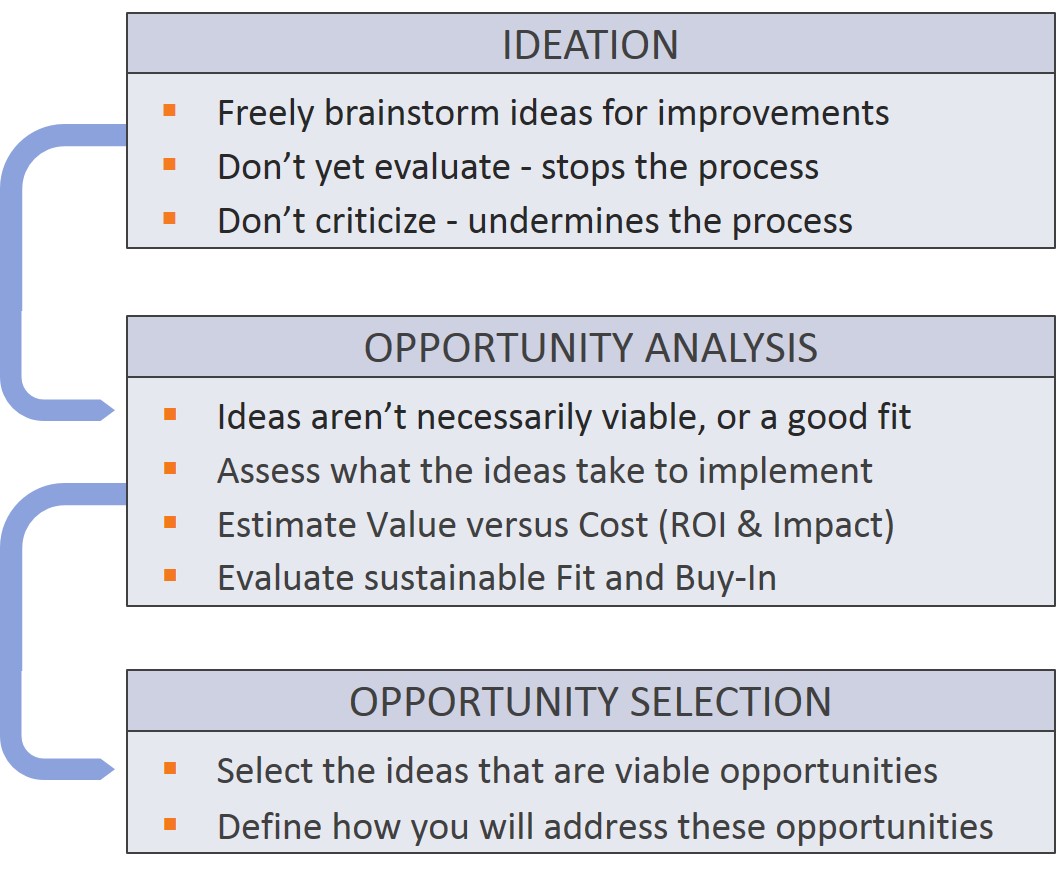 The purpose of the opportunity analysis session is to evaluate whether the ideas identified through ideation are suitable and viable opportunities for the business. In this session, analyze the ideas for criteria, such as:
- Is within scope and addresses the goal and objectives
- Produces Return on Investment (value exceeds cost)
- Creates the desired result or impact
- Matches the interests and/or covers issues to be addressed
- Can be pragmatically implemented and will work
- Fits the team, organization and other business aspects
- Fits together with other selected opportunities
- Fits the budget or can be justified outside the budget
- Addresses other aspects relevant to the stakeholders
At the end of the session, select the best opportunities, verify that they cover all issues and/or interests to be addressed, and define how you will address the selected opportunities.
You may have to conduct multiple ideation and opportunity analysis sessions as things progress. For instance in BRM you will likely need multiple sessions as you go through the cycles of resolving the biggest bottlenecks.
Note: Just because an idea isn't an opportunity, that doesn't make them bad ideas. In the interest of maintaining the relationship, it is better not to pass such judgment, even when you think an idea is bad. Discussions about whether an idea is good or bad only serve to distract and undermine the negotiation. As it isn't relevant, don't unnecessarily step on people's toes during opportunity analysis.
Library
The process maps in this library were developed by participants of MeHI's Change Management and Process Improvement workshops organized by MeHI from 2018 to 2020. These documents are provided as examples to help generate ideas for Process Improvement. The maps are organized by Health IT topic, e.g. HIE and Electronic Patient Engagement. New topics may be added in the future.
Be careful not to force other people's processes on your team, as process maps and best practices created by one team rarely apply to other teams. Significant adaptation may be required to accommodate for differences in business scope and objectives, management style, team makeup, customer base, and other factors.
HIE Process Maps
|
Process |
PDF Process Map Downloads |
Description |
||
|---|---|---|---|---|
| Closed-loop referral between a PCP and a specialist | ||||
|
Closed Loop Referral |
This map depicts how to ensure a closed-loop referral workflow in cases where a Primary Care Provider (PCP) refers a patient to a specialist, and the specialist then examines the patient and sends a consult note back to the patient's PCP. This workflow can be used as a template to map any closed-loop referral process. |
|||
| PDF Map | Visio Map | |||
| A closed-loop referral between a PCP and specialist, with a highlight on referral scheduling | ||||
|
PCP to |
This map represents a closed-loop referral process from a primary care physician (PCP) to a specialist. The workflow highlights multiple ways to schedule an appointment with a specialist and how to ensure that each method results in appropriate communication and follow-up. |
|||
| PDF Map | Visio Map | |||
| Management of patient panel assigned to MassHealth ACO lead Community Partner (CP) who then refers a subset of patients to a CP Affiliate |
||||
|
ACO to CP |
This map represents cases where a MassHealth ACO's lead Community Partner (CP) organization receives a patient panel list and refers a subset of the patients to a CP Affiliate. This work-in-progress map can be used to discuss how to efficiently manage the ACO referral process. We welcome feedback from ACO and CP organizations so we can continue to refine this map. |
|||
| PDF Map | Visio Map | |||
| Medication reconciliation for a patient discharged from acute care and referred to a specialist | ||||
|
Medication |
This map illustrates how to generate and maintain an accurate and complete medication list when a patient is discharged from an acute care facility and referred to a specialist for follow-up care. The map can be used as a template for transition of care processes in which medication reconciliation needs to occur.
|
|||
| PDF Map | Visio Map | |||
Patient Engagement Process Maps
|
Process |
PDF Process Map Downloads |
Description |
||
|---|---|---|---|---|
| Sign-up process for a patient who is new to the patient portal | ||||
|
Patient Portal |
This map shows how to work with a patient to establish portal access for the patient during an office visit as part of the appointment check-in process. The map targets patients who are more likely to use a patient portal, e.g. patients with chronic issues who need frequent office visits. |
|||
| PDF Map | Visio Map | |||
| Demonstration of patient portal benefits and patient portal training to increase patient use | ||||
|
Patient Portal
|
This map shows how to increase portal utilization by engaging with a patient at various points during an office visit, e.g. when patients wait for the next step in their care. It illustrates how staff-patient interactions present opportunities to highlight the benefits. To increase efficiency, the workflow targets patients who are more likely to use a portal, e.g. patients with chronic issues who can benefit from remote care. |
|||
| PDF Map | Visio Map | |||
| Demo and training sub-process | ||||
|
Patient Portal |
This map depicts a strategy to conduct a portal demo followed by hands-on portal training for the patient, where patients can see how the portal can benefit their care. The premise is that when patients are assisted in discovering how a portal helps improve care, they become more likely to use it. This is similar to training the clinical staff how to use an EHR. |
|||
| PDF Map | Visio Map | |||
| Patient portal education and guidance by an MD/NP during a patient visit to increase patient use | ||||
|
Patient Portal
|
This map shows how to leverage the relationships between patients and MDs and NPs to increase portal utilization. It highlights how patient education by a trusted MD or NP makes it more likely that patients will use the portal. To limit the time needed from an MD or NP, the map targets patients who can benefit the most from using the portal, e.g. patients with chronic issues who can benefit from monitoring trends in their related lab test data. |
|||
| PDF Map | Visio Map | |||
Patient Intake Process Maps
|
Process |
PDF Process Map Downloads |
Description |
||
|---|---|---|---|---|
| Patient Intake Process (This process uses sub-processes that incorporate various Health IT options to assist the Medical Staff in the intake process) |
||||
|
Patient Intake |
This map is designed to spark discussion about how technology could be leveraged to improve patient engagement during the patient intake process. To keep the main process focused, the map incorporates subprocesses, which were mapped separately to provide further insight and identify improvement opportunities for key aspects of the intake process. |
|||
| PDF Map | Visio Map | |||
| Patient Intake – Taking Vitals Sub-process | ||||
|
Taking Vitals Subprocess
|
This map shows the portion of the patient intake process that deals with the measurement and recording of a patient’s vital signs. The workflow demonstrates how automatic electronic recording of vital signs can increase efficiency and reduce the burden of data entry on medical assistants, thereby allowing more personal interaction with the patient. |
|||
| PDF Map | Visio Map | |||
| Patient Intake - Recording Quality Metrics Sub-process | ||||
|
Recording |
This map shows the documentation of quality measures in the EHR during the patient intake process. The map incorporates one example, smoking cessation counseling, but can be extended to cover other quality measures as well. The workflow highlights how using a scribe enables more personal interaction between a patient and their provider.
|
|||
| PDF Map | Visio Map | |||
| Patient Intake - Recording Social Determinants of Health Sub-process | ||||
|
Recording Social Determinants of Health Subprocess
|
This map depicts how to integrate patient responses to a Social Determinants of Health (SDOH) questionnaire into the EHR. The workflow highlights how the use of technology, such as patient portals and tablets, can increase efficiency and enable increased face-to-face interaction between a patient and their care provider during the visit. |
|||
| PDF Map | Visio Map | |||
| Patient Intake - Medication Reconciliation Sub-process | ||||
| Medication Reconciliation Subprocess |
This map represents the medication reconciliation component of the larger patient intake process. The workflow underscores opportunities to maximize patient engagement in the medication reconciliation process and potentially improve the accuracy of the patient’s current medication list. |
|||
| PDF Map | Visio Map | |||
Other Health IT Process Maps
|
Process |
PDF Process Map Downloads |
Description |
||
|---|---|---|---|---|
| Management of a Health IT development project | ||||
|
Health IT Project |
This map shows how to manage the development of a Health IT project, from problem breakdown, design and implementation, to testing, and ultimately to product release. The map offers a starting point for organizations aiming to efficiently build a comprehensive solution that involves developing new software or tools with involvement of the clinical and software development staff. |
|||
| PDF Map | Visio Map | |||


